
UNITED STATES
SECURITIES AND EXCHANGE COMMISSION
Washington, D.C. 20549
FORM 8-K
CURRENT REPORT
PURSUANT TO SECTION 13 OR 15(d) OF THE
SECURITIES EXCHANGE ACT OF 1934
Date of Report (Date of earliest event reported): October 26, 2026
(Exact name of registrant as specified in its charter)
(State or other jurisdiction of incorporation or organization) | (Commission file number) | (IRS Employer Identification No.) | ||||||
(Address of principal executive offices) (Zip Code)
(301 ) 468-8848
Registrant’s telephone number, including area code
Not Applicable
(Former Name or Former Address, if Changed Since Last Report)
Check the appropriate box below if the Form 8-K filing is intended to simultaneously satisfy the filing obligations of the registrant under any of the following provisions:
Securities registered pursuant to Section 12(b) of the Act:
| Title of Each Class | Trading Symbol | Name of Each Exchange on Which Registered | ||||||
Indicate by check mark whether the registrant is an emerging growth company as defined in Rule 405 of the Securities Act of 1933 (§230.405 of this chapter) or Rule 12b-2 of the Securities Exchange Act of 1934 (§240.12b-2 of this chapter).
Emerging growth company ☐
If an emerging growth company, indicate by check mark if the registrant has elected not to use the extended transition period for complying with any new or revised financial accounting standards provided pursuant to Section 13(a) of the Exchange Act. ☐
Item 2.02 Results of Operations and Financial Disclosure
On October 26, 2026 , Capital Bancorp, Inc. (the “Company”) issued a press release announcing the Company’s unaudited financial results for the three and nine months ended September 30, 2026. A copy of the press release is furnished as Exhibit 99.1 to this Current Report on Form 8-K and hereby incorporated by reference. A presentation regarding the Company's financial results for the three and nine months ended September 30, 2026 is furnished as Exhibit 99.2 and incorporated herein by reference.
The information furnished under Item 2.02 and Item 9.01 of this Current Report on Form 8-K, including Exhibit 99.1 and Exhibit 99.2 to this Current Report on Form 8-K, shall not be deemed “filed” for purposes of Section 18 of the Securities Exchange Act of 1934, as amended, or otherwise subject to liabilities under that Section, nor shall it be deemed incorporated by reference in any registration statement or other filings of the Company under the Securities Act of 1933, as amended, except as shall be set forth by specific reference in such filing.
Item 8.01. Other Events
On October 23, 2026, the Company's Board of Directors declared a $0.14 per share dividend. The dividend is payable on November 25, 2026 to stockholders of record on November 9, 2026.
Item 9.01. Financial Statements and Exhibits
(d) Exhibits
| 99.1 | |||||
| 99.2 | |||||
| 104 | Cover Page Interactive Data File (embedded within the Inline XBRL document) | ||||
2
SIGNATURES
Pursuant to the requirements of the Securities Exchange Act of 1934, the Registrant has duly caused this report to be signed on its behalf by the undersigned hereunto duly authorized.
| CAPITAL BANCORP, INC. | |||||
Date: | By: /s/ Jacob Dalaya | ||||
| Name: Jacob Dalaya | |||||
| Title: Chief Financial Officer | |||||
3

CBNK Delivers Strong Revenue Growth and Positive Operating Leverage
Rockville, Maryland, October 26, 2026 (GLOBE NEWSWIRE) – Capital Bancorp, Inc. (the "Company") (NASDAQ: CBNK), the holding company for Capital Bank, N.A. (the "Bank"), today reported:
| Quarter Ended | % Change (Annualized) | |||||||||||||||||||||||||||||||
| (in millions, except per share data) | 3Q26 | 2Q26 | 3Q25 | 3Q26 vs 2Q26 | 3Q26 vs 3Q25 | |||||||||||||||||||||||||||
| Balance Sheet Summary | ||||||||||||||||||||||||||||||||
Gross Loans(1) | $3,114 | $3,086 | $2,822 | 3.6% | 10.4% | |||||||||||||||||||||||||||
| Total Deposits | 3,319 | 3,371 | 2,912 | (6.1)% | 14.0% | |||||||||||||||||||||||||||
Customer Deposits(2) | 2,988 | 3,140 | 2,675 | (19.2)% | 11.7% | |||||||||||||||||||||||||||
Tangible Book Value per share(3) | $23.98 | $23.45 | $21.33 | 9.0% | 12.4% | |||||||||||||||||||||||||||
| GAAP | Core(3) | |||||||||||||||||||||||||||||||||||||||||||||||||||||||||||||
| Quarter Ended | Change | Quarter Ended | Change | |||||||||||||||||||||||||||||||||||||||||||||||||||||||||||
| (in millions, except per share data) | 3Q26 | 2Q26 | 3Q25 | 3Q26 vs 2Q26 | 3Q26 vs 3Q25 | 3Q26 | 2Q26 | 3Q25 | 3Q26 vs 2Q26 | 3Q26 vs 3Q25 | ||||||||||||||||||||||||||||||||||||||||||||||||||||
| Earnings Summary | ||||||||||||||||||||||||||||||||||||||||||||||||||||||||||||||
| Net Income | $13.1 | $14.3 | $15.1 | (7.9)% | (12.9)% | $14.7 | $14.3 | $12.2 | 3.2% | 21.0% | ||||||||||||||||||||||||||||||||||||||||||||||||||||
| Earnings per share - diluted | $0.80 | $0.87 | $0.89 | (8.0)% | (10.1)% | $0.89 | $0.87 | $0.72 | 2.3% | 23.6% | ||||||||||||||||||||||||||||||||||||||||||||||||||||
| ROA | 1.38% | 1.52% | 1.77% | (14) bps | (39) bps | 1.55% | 1.52% | 1.43% | 3 bps | 12 bps | ||||||||||||||||||||||||||||||||||||||||||||||||||||
ROTCE(3) | 13.62% | 15.51% | 17.49% | (189) bps | (387) bps | 15.24% | 15.51% | 14.15% | (27) bps | 109 bps | ||||||||||||||||||||||||||||||||||||||||||||||||||||
| Including Card | Excluding Card | |||||||||||||||||||||||||||||||||||||||||||||||||||||||||||||
| NIM | 5.81% | 5.64% | 6.36% | 17 bps | (55) bps | 4.18% | 4.04% | 4.66% | 14 bps | (48) bps | ||||||||||||||||||||||||||||||||||||||||||||||||||||
| GAAP | Core(3) | |||||||||||||||||||||||||||||||||||||
| Nine Months Ended | Change | Nine Months Ended | Change | |||||||||||||||||||||||||||||||||||
| (in millions, except per share data) | 3Q26 | 3Q25 | 3Q26 vs 3Q25 | 3Q26 | 3Q25 | 3Q26 vs 3Q25 | ||||||||||||||||||||||||||||||||
| Earnings Summary | ||||||||||||||||||||||||||||||||||||||
| Net Income | $39.4 | $42.1 | (6.5)% | $41.0 | $41.3 | (0.7)% | ||||||||||||||||||||||||||||||||
| Earnings per share - diluted | $2.40 | $2.50 | (4.0)% | $2.49 | $2.45 | 1.6% | ||||||||||||||||||||||||||||||||
| ROA | 1.41% | 1.71% | (30) bps | 1.47% | 1.67% | (20) bps | ||||||||||||||||||||||||||||||||
ROTCE(3) | 14.24% | 17.06% | (282) bps | 14.80% | 16.70% | (190) bps | ||||||||||||||||||||||||||||||||
| Including Card | Excluding Card | |||||||||||||||||||||||||||||||||||||
| NIM | 5.72% | 6.15% | (43) bps | 4.12% | 4.48% | (36) bps | 1 | |||||||||||||||||||||||||||||||
“This was indeed a very busy quarter with the announcements of the merger with Peoples Bank and the sale of our Chicago branch,” said Steven J. Schwartz, Chairman of the Company. “However, it is also important to note our continued steady net interest margin and tangible net book value(3) growth, along with sustained double-digit loan growth and the quarter-over-quarter increase in core earnings per share. The Board is excited about both the synergistic opportunities the merger provides as well as our independent organic growth and performance prospects.”
(1) Gross loans represent portfolio loans receivable, net of deferred fees and costs.
(2) Customer deposits represent total deposits excluding brokered deposits.
(3) As used in this press release, Core net income, Core earnings per share - diluted, Core ROA, Core ROTCE, Tangible Book Value per share are non-GAAP financial metrics. These non-GAAP financial metrics exclude the impact of merger-related expenses and certain other pre-tax adjustments which are not indicative of operating performance and the tax impacts of such adjustments. Reconciliations of this and other non-GAAP measures to their comparable GAAP measures are set forth in the Appendix at the end of this press release.
1
Third Quarter 2026 Highlights
•On September 29, 2026 the Company announced it has entered into a definitive merger agreement under which Peoples Bancorp, Inc. ("Peoples") will acquire Capital Bancorp, Inc. in an all-stock transaction. Under the terms of the agreement, shareholders will receive 1.11 shares of Peoples common stock for each share of the Company's common stock, representing an implied value of $43.75 per share and an approximate 22.7% premium over the Company's closing stock price on September 29, 2026. The implied value represented a 1.9x tangible book value per share(1) and 12.9x last-twelve-month earnings per share - diluted for the quarter ended June 30, 2026. The transaction is subject to receipt of required regulatory approvals, shareholder approval, and other customary closing conditions
•On September 29, 2026 the Company announced it has entered into a purchase and assumption agreement with respect to the Bank's branch office located in North Riverside, Illinois ("Chicago branch"), subject to regulatory approvals and other customary closing conditions. Based on the composition of deposits at September 30, 2026, the Bank would have received a deposit premium of approximately $3.2 million had the transaction closed at that date. The Bank will also receive a payment equal to the unpaid principal balance of loans transferred in the transaction, which could result in an additional gain at the time of closing
•Total deposits decreased $52.0 million or 6.1% (annualized) from 2Q 2026, primarily driven by decreases of $89.3 million from DDA products associated with our Title business, consistent with regular seasonality. The decrease in deposits also included a $45.2 million reduction associated with a single customer relationship that had grown significantly throughout the year and which was noted in the 2Q 2026 earnings release. Excluding deposits from title companies and the single customer relationship, deposits increased $82.5 million or 11.8% (annualized)
•Noninterest expenses increased $2.5 million or 23.3% (annualized) from 2Q 2026 as we continued to execute on strategic growth initiatives and incurred merger-related expenses related to the pending merger with Peoples. Excluding the impact of merger-related expenses, Core noninterest expenses(1) increased $1.0 million or 8.8% (annualized) from 2Q 2026
•Generated $80.2 million, or 10.2% (annualized) growth in total gross loans from 2Q 2026, largely driven by commercial and industrial ("C&I"), which grew $47.1 million, or 25.6% (annualized), across both held for sale and held for investment portfolios, and residential real estate, which grew $26.1 million, or 13.0% (annualized), across both held for sale and held for investment portfolios
•Continued tangible book value compounding, with tangible book value per share(1) increasing 9.0% (annualized) from 2Q 2026
•NIM of 5.81% increased 17 bps from 2Q 2026, driven by 14 bps from the Commercial Bank loan portfolio and 4 bps increased contribution from OpenSkyTM due to higher balances, partially offset by 1 bp from other Commercial Bank activity. Core NIM of 4.18% increased 14 bps from 2Q 2026, primarily driven by 11 bps from organic growth from Commercial Bank portfolio.
•Diluted earnings per share of $0.80, down 8.0% from 2Q 2026. Core earnings per share(1) increased $0.02, or 2.3% from 2Q 2026
•Produced 18.7% (annualized) fee income growth, led by government lending revenue, loan servicing rights income, credit card fees and USDA fees. Fee revenue represented 22.1% of total revenue
•The Company also declared a cash dividend on its common stock of $0.14 per share. The dividend is payable on November 25, 2026 to shareholders of record on November 9, 2026.
“We are excited about our combination with Peoples Bank and what it will bring to our franchises" said Ed Barry, CEO of the Company. "Our current quarter results reflect work on the merger and continued progress on our strategic plan. Prudent and disciplined financial management is demonstrated in our ability to deliver strong profitability in a volatile operating environment."
(1) As used in this press release, Core noninterest expense, Core net income, Core earnings per share - diluted, Core ROA, Core ROTCE, Tangible Book Value per share are non-GAAP financial measures. These non-GAAP financial metrics exclude the impact of merger-related expenses and certain other pre-tax adjustments which are not indicative of operating performance and the tax impacts of such adjustments. Reconciliations of this and other non–GAAP measures to their comparable GAAP measures are set forth in the Appendix at the end of this press release.
2
Reconciliation of GAAP Net Income to Core (Non-GAAP) Net Income
The following table provides a reconciliation of the Company's net income under GAAP to Core net income (non-GAAP) results excluding brokered time deposit call, merger-related expenses and other one-time non-recurring transactions.
Third Quarter 2026 | Second Quarter 2026 | Third Quarter 2025 | |||||||||||||||||||||||||||||||||||||||||||||||||||
| (in thousands) | Income Before Income Taxes | Income Tax Expense (Benefit) | Net Income | Income Before Income Taxes | Income Tax Expense | Net Income | Income Before Income Taxes | Income Tax Expense (Benefit) | Net Income | ||||||||||||||||||||||||||||||||||||||||||||
| GAAP Net Income | $ | 17,546 | $ | 4,424 | $ | 13,122 | $ | 18,454 | $ | 4,204 | $ | 14,250 | $ | 19,867 | $ | 4,802 | $ | 15,065 | |||||||||||||||||||||||||||||||||||
| Deduct: Income from the Call of Brokered Time Deposits | — | — | — | — | — | — | (4,618) | (1,129) | (3,489) | ||||||||||||||||||||||||||||||||||||||||||||
| Add: Merger-Related Expenses | 1,577 | — | 1,577 | — | — | — | 697 | 122 | 575 | ||||||||||||||||||||||||||||||||||||||||||||
Core Net Income(1) | $ | 19,123 | $ | 4,424 | $ | 14,699 | $ | 18,454 | $ | 4,204 | $ | 14,250 | $ | 15,946 | $ | 3,795 | $ | 12,151 | |||||||||||||||||||||||||||||||||||
| Nine Months Ended September 30, 2026 | Nine Months Ended September 30, 2025 | ||||||||||||||||||||||||||||||||||
| (in thousands) | Income Before Income Taxes | Income Tax Expense (Benefit) | Net Income | Income Before Income Taxes | Income Tax Expense | Net Income | |||||||||||||||||||||||||||||
| GAAP Net Income | $ | 51,871 | $ | 12,481 | $ | 39,390 | $ | 55,263 | $ | 13,130 | $ | 42,133 | |||||||||||||||||||||||
| Deduct: Income from the Call of Brokered Time Deposits | — | — | — | (4,618) | (1,129) | (3,489) | |||||||||||||||||||||||||||||
| Add: Merger-Related Expenses | 1,577 | — | 1,577 | 3,361 | 752 | 2,609 | |||||||||||||||||||||||||||||
Core Net Income(1) | $ | 53,448 | $ | 12,481 | $ | 40,967 | $ | 54,006 | $ | 12,753 | $ | 41,253 | |||||||||||||||||||||||
Note: The income tax expense reflects the non-deductibility of certain merger-related expenses.
Net income of $13.1 million decreased $1.1 million compared to 2Q 2026, and earnings per share - diluted of $0.80 decreased $0.07 per share from 2Q 2026. Net income decreased $1.9 million, or 12.9%, compared to $15.1 million, or $0.89 per diluted share, for 3Q 2025. 3Q 2026 Core net income(1) of $14.7 million, or $0.89 per diluted share, increased $0.4 million, or 3.2%, compared to 2Q 2026 Core net income(1) of $14.3 million, or $0.87 per diluted share. 3Q 2026 Core net income(1) increased $2.5 million from 3Q 2025 Core net income(1) of $12.2 million. 3Q 2026 Core net income(1) excluding purchase accounting accretion ("PAA") was $14.4 million, an increase of $2.9 million, or 25.2%, from 3Q 2025 Core net income(1) of $11.5 million excluding PAA.
Consolidated Financial Performance
Quarterly net interest income:
•Net interest income of $53.1 million increased $2.1 million, or 4.2% (not annualized), compared to 2Q 2026, and increased $1.1 million, or 2.0%, year-over-year.
◦Interest income of $72.3 million increased $2.3 million, or 3.3% (not annualized), compared to 2Q 2026, and increased $7.4 million, or 11.4%, year-over-year. The increase from 2Q 2026 was primarily driven by a $2.4 million increase from Commercial Bank loan growth and $0.5 million increase from OpenSky™ due to higher balances and higher yields, slightly offset by a $0.5 million decrease in interest bearing cash income due to lower balances of interest-bearing deposits from other financial institutions. The increase year-over-year was primarily driven by $6.5 million from the Commercial Bank due to strong organic loan growth, and $0.9 million from OpenSky™ due to strong growth from the unsecured loan product.
▪Interest income included $0.3 million from net PAA in 3Q 2026, compared to $0.2 million in 2Q 2026 and $0.2 million in net PAA in 3Q 2025.
◦Interest expense of $19.2 million increased $0.2 million, or 1.0% (not annualized), compared to 2Q 2026, and increased $6.3 million, or 49.3%, year-over-year. The increase of $0.2 million, compared to 2Q 2026, was primarily driven by growth in money market accounts, offset by a decrease in borrowed funds. The increase of $6.3 million year-over-year was driven by $1.0 million from higher balances and a shift in deposit mix, $5.2 million of decreased benefit from net PAA, and $0.1 million of higher borrowing costs.
(1) As used in this press release, Core net income and Core noninterest expense are non-GAAP financial measures. These non-GAAP financial metrics exclude the impact of merger-related expenses and certain other pre-tax adjustments which are not indicative of operating performance and the tax impacts of such adjustments. Reconciliations of this and other non–GAAP measures to their comparable GAAP measures are set forth in the Appendix at the end of this press release.
3
Consolidated Financial Performance (continued)
▪Interest expense included a $0.1 million benefit from net PAA in both 3Q 2026 and 2Q 2026. There was a $5.3 million benefit from net PAA in 3Q 2025, which included $4.6 million from the call of brokered time deposits acquired from the IFH transaction ("Call of Brokered Time Deposits").
Quarterly provision:
•The 3Q 2026 provision for credit losses was $4.9 million, an increase of $1.3 million from 2Q 2026. The increase was primarily driven by $1.3 million of increased provision for the Commercial Bank from 2Q 2026, primarily due to a $1.0 million increased reserve requirement largely attributable to loan growth and $0.3 million decrease in net charge-offs. Net charge-offs totaled $3.8 million, or 0.49% of portfolio loans (annualized), consistent with $3.8 million or 0.50% of portfolio loans (annualized), in 2Q 2026.
◦Net charge-offs in the quarter included $3.2 million from OpenSky™ loans and $0.6 million from Commercial Bank loans. Net charge-offs for the Commercial Bank decreased $0.3 million quarter-over-quarter. OpenSky™ net charge-offs increased $0.3 million quarter-over-quarter, driven by the secured product.
◦At September 30, 2026, the ACL Coverage Ratio was 1.78%, an increase of 2 bps from June 30, 2026.
Quarterly fee revenue:
•Fee Revenue of $15.0 million increased $0.7 million, compared to 2Q 2026 and increased $4.0 million year-over-year. The increase of $0.7 million during 3Q 2026 was primarily driven by a $0.4 million increase in other income from fees associated with USDA transactions that did not close and an increase in small business investment company ("SBIC") income, and a $0.3 million increase in government lending revenue from both USDA and SBA gain on sale. The year-over-year fee revenue increase of $4.0 million was primarily driven by a $1.5 million increase in government lending revenue mostly from USDA gain on sale, $1.2 million from SBIC income, $0.8 million from government loan servicing and packaging revenue (Windsor™) driven by growth in servicing income from organic growth in the servicing portfolio, and $0.3 million from fees earned from USDA deals which were not executed. Fee revenue mix(1) was 22.1% of total revenue for 3Q 2026, compared to 22.0% during 2Q 2026, and 17.5% during 3Q 2025. Core fee revenue mix was 22.1% for 3Q 2026, compared to 22.0% during 2Q 2026, and 18.9% during 3Q 2025.
Quarterly noninterest expense:
•Noninterest expense of $45.7 million increased $2.5 million compared to 2Q 2026 and increased $7.4 million compared to 3Q 2025. Core noninterest expense(2) of $44.1 million increased $1.0 million compared to 2Q 2026 and increased $6.5 million compared to 3Q 2025. Core comparisons include:
◦The increase of $1.0 million quarter-over-quarter was primarily driven by $1.0 million higher personnel costs primarily due to planned investment in headcount
◦Year-over-year expense growth of $6.5 million was primarily driven by planned expansion and investment in headcount across the organization, and an increase in professional fees associated with investments in shared services areas and OpenSky™.
Quarterly income taxes:
•Income tax expense of $4.4 million, or 25.2% of pre-tax income for 3Q 2026, increased $0.2 million from $4.2 million, or 22.8% of pre-tax income for 2Q 2026. The effective income tax rate change quarter-over-quarter primarily reflects $1.6 million of non-deductible merger costs. Our Core effective income tax rate excluding non-deductible merger costs was 23.1% for 3Q 2026.
(1) Fee revenue mix equals fee revenue divided by the sum of fee revenue and net interest income before provision for credit losses.
(2) As used in this press release, Core noninterest expense, Core net income, Core earnings per share - diluted, Core ROA, Core ROTCE, Tangible Book Value per share are non-GAAP financial measures. These non-GAAP financial metrics exclude the impact of merger-related expenses and certain other pre-tax adjustments which are not indicative of operating performance and the tax impacts of such adjustments. Reconciliations of this and other non–GAAP measures to their comparable GAAP measures are set forth in the Appendix at the end of this press release.
4
Consolidated Financial Performance (continued)
Total assets:
Total assets of $3.8 billion at September 30, 2026 decreased $87.4 million, or 8.9% (annualized) from June 30, 2026. The $87.4 million decrease was primarily driven by $156.2 million of decreased cash and cash equivalents, offset by total loan growth of $80.2 million (inclusive of portfolio loans receivable and loans held for sale). Total assets growth year-over-year was $413.1 million, or 12.2%. The growth year-over-year was primarily driven by increases in portfolio loans and cash balances.
Gross Loans:
•Total loans increased $80.2 million driven by increases in loans held for sale of $51.9 million and loans held for investment of $28.3 million
•Loans held for sale increased $51.9 million, primarily driven by a reclassification of $60.2 million of loans from held for investment to held for sale due to the pending Chicago branch sale, subject to mutual agreement with the buyer on the loan population.
•Gross Loans held for investment of $3.1 billion at September 30, 2026 increased $28.3 million, or 3.6% (annualized), from June 30, 2026 and increased $292.3 million, or 10.4%, year-over-year.
◦Excluding the impact of $60.2 million of loans reclassified to held for sale, gross loans held for investment increased $88.5 million, or 11.4% (annualized) from June 30, 2026.
◦Compared to June 30, 2026, growth was primarily driven by $42.7 million from C&I and $10.0 million from construction real estate, slightly offset by a $21.1 million decrease in commercial real estate.
▪The $42.7 million growth from C&I was driven by $20.1 million SBA, $14.7 million legacy, and $7.9 million USDA.
◦C&I loans, plus owner-occupied CRE loans, totaled 38.3% of total portfolio loans at September 30, 2026, 37.4% at June 30, 2026, and 37.6% at September 30, 2025.
Deposits:
•Total deposits of $3.3 billion at September 30, 2026 decreased $52.0 million, or 6.1% (annualized), from June 30, 2026, and increased $407.1 million, or 14.0% from September 30, 2025.
◦Excluding a $99.9 million increase in brokered time deposits, customer deposits decreased $151.8 million or 19.2% (annualized), which was driven by an $89.3 million decrease from DDA products associated with our Title business due to typical seasonality, a $35.6 million increase from organic activity, and a $26.9 million decrease from customer time deposits which were not renewed or extended.
▪The $151.8 million decrease includes $68.4 million from interest-bearing demand accounts, $52.8 million from noninterest-bearing deposits, $11.2 million from customer money market deposits, and $26.9 million from customer time deposits, partially offset by $7.5 million of growth from savings accounts.
◦The increase in total deposits of $407.1 million year-over-year was primarily driven by $390.4 million in growth from customer money market deposits and $17.7 million from high yield savings accounts, with offsetting activity across other deposit products.
◦Total deposits include $111.1 million of deposits expected to be assumed in connection with the pending Chicago branch sale, subject to finalization of the purchase and assumption agreement.
◦Insured and protected(1) deposits were approximately $2.2 billion as of September 30, 2026 representing 66.6% of the Company's deposit portfolio.
(1) Protected deposits include deposits that are indirectly protected under the product terms.
5
Consolidated Financial Performance (continued)
◦Low interest(1) and noninterest-bearing demand deposit account ("DDA") deposits totaled $1.2 billion, or 36.1% of deposits, a decrease of $113.8 million, or 8.7% from 2Q 2026, and an increase of $52.1 million, or 4.5% year-over-year.
▪The average rate on the low interest and noninterest-bearing deposits was 0.30% for 3Q 2026, which increased 1 bps compared to 2Q 2026 and increased 15 bps year-over-year.
•The average portfolio loans-to-deposit ratio was 96.0% for 3Q 2026, compared to 94.3% for 2Q 2026, and 95.6% for 3Q 2025.
Investment securities:
•The investment securities portfolio continues to be classified as available-for-sale and had a fair market value of $214.5 million, or 5.6% of total assets, and an effective duration of 2.4 years, with U.S. Treasury Securities representing 61% of the overall investment portfolio at September 30, 2026. The accumulated other comprehensive loss on the investment securities portfolio increased $2.9 million during the quarter to $9.2 million after-tax as of September 30, 2026, which represents 2.1% of total stockholders' equity. The Company does not have a held-to-maturity investment securities portfolio.
Liquidity:
•The Company maintains stable and diversified sources of contingent liquidity, generally consistent with the prior quarter. Total available borrowing capacity as of September 30, 2026 was $842.6 million, compared to $801.6 million as of June 30, 2026, consisting of $736.0 million of available collateralized borrowing capacity, $100.5 million of unsecured lines of credit with other banks, and $6.1 million of unpledged investment securities available to collateralize potential additional borrowings. Including cash and cash equivalents of $262.0 million, total liquidity was approximately $1.1 billion.
Capital:
•As of September 30, 2026, the Company reported a Common Equity Tier-1 capital ratio of 13.25% and a Tier 1 leverage ratio of 10.84%, compared to 13.16% and 10.51%, respectively, at June 30, 2026. At September 30, 2026, the Company and the Bank maintained regulatory capital ratios that exceed all capital adequacy requirements.
•There were no shares repurchased and retired during the three months ended September 30, 2026, as part of the Company's stock repurchase program. As of September 30, 2026, there was $12.4 million remaining to be repurchased under the current $15.0 million authorized repurchase program, which will expire on December 31, 2026. In connection with the merger agreement with Peoples, the Company has suspended its stock repurchase program and does not currently expect to repurchase additional shares while the proposed transaction is pending.
(1) Low interest deposits include interest-bearing demand and savings accounts.
6
Financial Metrics
Net Interest Margin:
NIM of 5.81% for 3Q 2026, increased 17 bps compared to the prior quarter, but decreased 55 bps year-over-year. Core NIM(1) of 4.18% increased 14 bps (but increased 12 bps when excluding PAA) compared to the prior quarter, and decreased 48 bps year-over-year. Net PAA for 3Q 2026 was 4 bps for NIM and 5 bps for Core NIM(1). The increase quarter-over-quarter in Core NIM includes 11 bps from organic growth from Commercial Bank portfolio, 2 bps from one non-performing loan relationship in 2Q 2026, and 1 bp from higher net PAA compared to 2Q 2026. There was $4.6 million of PAA from the Call of Brokered Time Deposits during 3Q 2025, or 56 bps of NIM and 59 of Core NIM. Excluding the impact from the Call of Brokered Time Deposits, NIM increased 1 bp and Core NIM increased 11 bps year-over-year.
•The average yield on interest earning assets of 7.91% increased 16 bps compared to the prior quarter and decreased 2 bps year-over-year. The increase quarter-over-quarter was due to growth in both the Commercial Bank and OpenSky™ portfolios. The decrease year-over-year was primarily due to the impact of changes in the rate environment to the Commercial Bank and OpenSky™ portfolios.
◦The Core Loan Yield(1) of 6.83% for 3Q 2026 increased 6 bps compared to 2Q 2026, and increased 9 bps year-over-year. The increase quarter-over-quarter includes 3 bps from organic portfolio growth and 3 bps from loan PAA. The increase year-over-year was primarily a result of organic portfolio growth.
•The total cost of deposits of 2.30% for 3Q 2026 increased 1 bp compared to 2Q 2026, and increased 57 bps year-over-year. The increase year-over-year was primarily due to 63 bps from the Call of Brokered Time Deposits in 3Q 2025. Excluding the Call of Brokered Time Deposits from 3Q 2025, total cost of deposits would have decreased 6 bps year-over-year, primarily driven by a shift in product mix as well as changes in the rate environment offsetting lower time deposit PAA.
•The total cost of interest-bearing deposits of 3.09% for 3Q 2026, remained consistent compared to the prior quarter, and increased 68 bps year-over-year. The increase year-over-year was primarily due to 87 bps from the Call of Brokered Time Deposits in 3Q 2025. Excluding the Call of Brokered Time Deposits from 3Q 2025, total cost of interest-bearing deposits would have decreased 19 bps year-over-year, which was primarily driven by a shift in product mix as well as changes in the rate environment.
•Net PAA of $0.4 million, or 4 bps of NIM and 5 bps of Core NIM(1), during 3Q 2026, increased $0.1 million from 2Q 2026 due to $0.2 million from the acceleration of PAA from a loan that paid off during 3Q 2026, partially offset by $0.1 million lower time deposit PAA from the run-off of certain purchase accounting marks associated with acquired IFH deposit portfolio. There was $5.5 million from net PAA during 3Q 2025, which includes $4.6 million, or 59 bps of Core NIM, from the Call of Brokered Time Deposits. Excluding the impact from the Call of Brokered Time Deposits, net PAA decreased $0.5 million mainly driven by lower time deposit PAA.
Credit Metrics and Asset Quality:
Nonperforming assets were $60.5 million, or 1.59% of total assets, at September 30, 2026, a decrease of $0.3 million but an increase of 3 bps from June 30, 2026. The decrease of $0.3 million was primarily driven by the acquired IFH portfolio. Nonperforming assets increased $8.3 million or 5 bps year-over-year, mainly due to the $9.7 million increase during 2Q 2026 related to the legacy bank loan relationship noted during 2Q 2026. At September 30, 2026, substandard loans totaled $71.4 million, or 2.3% of total portfolio loans, compared to $70.6 million, or 2.3% of total portfolio loans, at June 30, 2026 and $56.8 million, or 2.0% of total portfolio loans, at September 30, 2025. The $14.6 million year-over-year increase in substandard loans was primarily driven by the $9.7 million legacy bank relationship that is referenced above. At September 30, 2026, special mention loans totaled $67.8 million, or 2.2%, of total portfolio loans, compared to $61.5 million, or 2.0% of total portfolio loans, at June 30, 2026, and $71.5 million, or 2.5% of total portfolio loans, at September 30, 2025.
Efficiency Ratio:
The efficiency ratio was 67.1% for 3Q 2026, compared to 66.1% for 2Q 2026 and 60.8% for 3Q 2025. The Core efficiency ratio(1) was 64.8% for 3Q 2026, which decreased from 66.1% compared to the prior quarter, and increased from 64.4% for 3Q 2025.
(1) As used in this press release, Core NIM, Core Loan Yield, and Core efficiency ratio are non-GAAP financial measures. These non-GAAP financial metrics exclude the impact of merger-related expenses and certain other pre-tax adjustments which are not indicative of operating performance and the tax impacts of such adjustments. Reconciliations of these and other non–GAAP measures to their comparable GAAP measures are set forth in the Appendix at the end of this press release.
7
Financial Metrics (continued)
Returns:
ROA was 1.38% for 3Q 2026, compared to 1.52% for 2Q 2026, and 1.77% for 3Q 2025. Core ROA(1) for 3Q 2026 was 1.55%, compared to 1.52% for 2Q 2026, and 1.43% for 3Q 2025.
•ROE was 12.16% for 3Q 2026, compared to 13.80% for 2Q 2026, and 15.57% for 3Q 2025. Core ROE(1) was 13.63% for 3Q 2026, compared to 13.80% for 2Q 2026, and 12.56% for 3Q 2025.
•ROTCE(1) was 13.62% for 3Q 2026, compared to 15.51% for 2Q 2026, and 17.49% for 3Q 2025. Core ROTCE(1) for 3Q 2026 was 15.24%, compared to 15.51% for 2Q 2026, and 14.15% for 3Q 2025.
Book Value:
Book value per common share of $26.42 at September 30, 2026, increased $0.50 when compared to June 30, 2026, and increased $2.62 when compared to September 30, 2025. Tangible book value per share(1) increased $0.53, or 2.3% (not annualized), to $23.98 at September 30, 2026 when compared to June 30, 2026, and increased $2.65, or 12.4%, when compared to September 30, 2025.
(1) As used in this press release, Core ROA, Core ROE, ROTCE, Core ROTCE, and Tangible Book Value are non-GAAP financial measures. These non-GAAP financial metrics exclude the impact of merger-related expenses and certain other pre-tax adjustments which are not indicative of operating performance and the tax impacts of such adjustments. Reconciliations of these and other non–GAAP measures to their comparable GAAP measures are set forth in the Appendix at the end of this press release.
8
Reportable Segments
Commercial Bank
Loan Growth – Portfolio loans(1) increased $24.8 million at September 30, 2026 compared to June 30, 2026, primarily driven by increases of $42.7 million from C&I, $10.0 million from construction real estate, and $5.6 million from lender finance, offset by decreases of $21.1 million from CRE and $13.5 million from residential real estate. Excluding the impact of $60.2 million of loans reclassified to held for sale, gross loans held for investment increased $88.5 million, or 11.4% (annualized) from June 30, 2026. Portfolio loans increased $276.5 million at September 30, 2026 compared to September 30, 2025, driven by $155.1 million from C&I, $44.2 million from residential real estate, $36.4 million from construction real estate, and $12.1 million from CRE. Historical gross portfolio loan balances are disclosed in the Composition of Loans table within the Historical Financial Highlights.
Net Interest Income – Interest income of $55.6 million increased $1.9 million from the prior quarter, driven by $2.4 million from loan growth, slightly offset by a $0.5 million decrease from interest bearing cash income. Interest expense of $19.1 million increased $0.2 million, driven by growth and a mix shift in the deposit portfolio.
Credit Metrics – Nonperforming assets increased 3 bps to 1.68% of total assets at September 30, 2026, compared to June 30, 2026. Total nonaccrual loans at September 30, 2026, were $56.7 million, a decrease of $0.3 million or 0.6% compared to $57.0 million at June 30, 2026.
Classified and Criticized Loans – At September 30, 2026, special mention loans totaled $67.8 million, or 2.2% of total portfolio loans, compared to $61.5 million, or 2.0% of total portfolio loans, at June 30, 2026. At September 30, 2026, substandard loans totaled $71.4 million, or 2.3% of total portfolio loans, compared to $70.6 million, or 2.3% of total portfolio loans, at June 30, 2026.
OpenSky™
OpenSky™ results reflected continued loan balance growth, lower operating expenses and credit performance consistent with management expectations.
Accounts – During 3Q 2026, credit card accounts declined to 575.8 thousand, decreasing 12.8 thousand, or 2.2% (not annualized) from June 30, 2026, and decreasing 11.8 thousand, or 2.0% year-over-year.
Loan and Deposit Balances – Secured and unsecured loan balances, net of reserves for interest and fees, of $149.2 million at September 30, 2026 increased by $3.9 million, or 2.7% (not annualized), compared to June 30, 2026, and increased $12.7 million, or 9.3%, year-over-year. Deposit balances of $162.4 million at September 30, 2026, decreased $3.8 million compared to June 30, 2026 and decreased $4.5 million, or 2.7% year-over-year. Gross unsecured loan balances of $57.6 million at September 30, 2026, increased $6.4 million, or 12.4% (not annualized), compared to $51.2 million at June 30, 2026, and increased $18.0 million, or 45.5% (not annualized), year-over-year. Gross secured loan balances of $93.7 million at September 30, 2026, decreased $2.4 million, or 2.5% (not annualized), compared to $96.0 million at June 30, 2026, and decreased $5.1 million, or 5.2% (not annualized) year-over-year.
Net Interest Income – Interest income of $16.5 million increased $0.5 million compared to 2Q 2026, supported by higher average OpenSky™ credit card loan balances. Average OpenSky™ credit card loan balances, net of reserves and deferred fees of $143.9 million for 3Q 2026, increased $6.8 million, or 5.0% (not annualized), compared to 2Q 2026.
Fee Revenue – Total fee revenue of $4.6 million increased $0.1 million from the prior quarter primarily driven by continued growth in net interest income as loan balances increased.
Noninterest Expense – Total noninterest expense of $15.7 million increased $0.3 million compared to 2Q 2026, driven by increased spending on professional services.
OpenSky™ Credit – Portfolio credit metrics continued to be generally consistent with modeled expectations during 3Q 2026. The provision for credit losses of $4.1 million increased $0.1 million when compared to the prior quarter. Net charge-offs increased $0.3 million to $3.2 million in 3Q 2026 from $2.9 million in 2Q 2026. The $0.3 million increase in charge-offs was primarily driven by the secured product and is consistent with normal seasonality and expectations for the card business. On a year-over-year basis, net charge-offs for the secured product increased only $0.1 million, while net charge-offs for the unsecured product increased $1.0 million, driven by growth in the unsecured portfolio. The majority of OpenSky's™ unsecured loan product is offered to current and former secured card customers, where the Company has historical customer performance data. Unsecured loans have been offered by OpenSky™ since the fourth
(1) Portfolio loans represents portfolio loans receivable excluding deferred origination fees, net.
9
quarter of 2021 and have generally performed in alignment with management expectations over that time period. OpenSky™ has begun testing limited offers to new customers; this activity remains insignificant to the overall unsecured loan portfolio and total accounts, and balances are expected to remain de minimis through year-end as management monitors performance.
Capital Bank Home Loans
Originations of loans held for sale totaled $75.3 million during 3Q 2026, with $47.9 million of mortgage loans sold resulting in a gain on sale of loans of $1.4 million, representing a 2.93% gain on sale as a percentage of total loans sold. Originations of loans held for sale totaled $106.9 million during 2Q 2026, with $87.1 million of mortgage loans sold resulting in a gain on sale of loans of $2.4 million, representing a 2.71% gain on sale as a percentage of total loans sold.
Windsor Advantage™
Gross government loan servicing revenue totaled $6.7 million, including $1.7 million of Capital Bank related servicing fees, during 3Q 2026. Gross government loan servicing revenue totaled $6.6 million, including $1.3 million of Capital Bank related servicing fees, during 2Q 2026. Windsor's™ total servicing portfolio was $3.5 billion at September 30, 2026, and $3.4 billion at June 30, 2026. In 3Q 2026, Windsor processed the closing of $183.9 million of government guaranteed loans, a 17.8% decrease from $223.6 million in 2Q 2026 and a 35.4% increase from $135.8 million in 3Q 2025.
10
| COMPARATIVE FINANCIAL HIGHLIGHTS - Unaudited | |||||||||||||||||||||||||||||||||||||||||
| Quarter Ended | 3Q26 vs 2Q26 | 3Q26 vs 3Q25 | |||||||||||||||||||||||||||||||||||||||
| (in thousands, except per share data) | September 30, 2026 | June 30, 2026 | September 30, 2025 | $ Change | % Change | $ Change | % Change | ||||||||||||||||||||||||||||||||||
| Earnings Summary | |||||||||||||||||||||||||||||||||||||||||
| Interest income | $ | 72,292 | $ | 69,959 | $ | 64,891 | $ | 2,333 | 3.3 | % | $ | 7,401 | 11.4 | % | |||||||||||||||||||||||||||
| Interest expense | 19,214 | 19,030 | 12,871 | 184 | 1.0 | % | 6,343 | 49.3 | % | ||||||||||||||||||||||||||||||||
| Net interest income | 53,078 | 50,929 | 52,020 | 2,149 | 4.2 | % | 1,058 | 2.0 | % | ||||||||||||||||||||||||||||||||
| Provision for credit losses | 4,903 | 3,585 | 4,650 | 1,318 | 36.8 | % | 253 | 5.4 | % | ||||||||||||||||||||||||||||||||
| Provision for (release of) credit losses on unfunded commitments | (54) | 65 | 217 | (119) | (183.1) | % | (271) | (124.9) | % | ||||||||||||||||||||||||||||||||
| Noninterest income | 15,039 | 14,361 | 11,068 | 678 | 4.7 | % | 3,971 | 35.9 | % | ||||||||||||||||||||||||||||||||
| Noninterest expense | 45,722 | 43,186 | 38,354 | 2,536 | 5.9 | % | 7,368 | 19.2 | % | ||||||||||||||||||||||||||||||||
| Income before income taxes | 17,546 | 18,454 | 19,867 | (908) | (4.9) | % | (2,321) | (11.7) | % | ||||||||||||||||||||||||||||||||
| Income tax expense | 4,424 | 4,204 | 4,802 | 220 | 5.2 | % | (378) | (7.9) | % | ||||||||||||||||||||||||||||||||
| Net income | $ | 13,122 | $ | 14,250 | $ | 15,065 | $ | (1,128) | (7.9) | % | $ | (1,943) | (12.9) | % | |||||||||||||||||||||||||||
Core net income(1) | $ | 14,699 | $ | 14,250 | $ | 12,151 | $ | 449 | 3.2 | % | $ | 2,548 | 21.0 | % | |||||||||||||||||||||||||||
Pre-tax pre-provision net revenue ("PPNR") (1) | $ | 22,395 | $ | 22,104 | $ | 24,734 | $ | 291 | 1.3 | % | $ | (2,339) | (9.5) | % | |||||||||||||||||||||||||||
Core PPNR(1) | $ | 23,972 | $ | 22,104 | $ | 20,813 | $ | 1,868 | 8.5 | % | $ | 3,159 | 15.2 | % | |||||||||||||||||||||||||||
| Common Share Data | |||||||||||||||||||||||||||||||||||||||||
| Earnings per share - Basic | $ | 0.81 | $ | 0.87 | $ | 0.91 | $ | (0.06) | (6.9) | % | $ | (0.10) | (11.0) | % | |||||||||||||||||||||||||||
| Earnings per share - Diluted | $ | 0.80 | $ | 0.87 | $ | 0.89 | $ | (0.07) | (8.0) | % | $ | (0.09) | (10.1) | % | |||||||||||||||||||||||||||
Core earnings per share - Diluted(1) | $ | 0.89 | $ | 0.87 | $ | 0.72 | $ | 0.02 | 2.3 | % | $ | 0.17 | 23.6 | % | |||||||||||||||||||||||||||
| Weighted average common shares - Basic | 16,294 | 16,288 | 16,586 | ||||||||||||||||||||||||||||||||||||||
| Weighted average common shares - Diluted | 16,482 | 16,373 | 16,844 | ||||||||||||||||||||||||||||||||||||||
| Return Ratios | |||||||||||||||||||||||||||||||||||||||||
| Return on average assets (annualized) | 1.38 | % | 1.52 | % | 1.77 | % | |||||||||||||||||||||||||||||||||||
Core return on average assets (annualized)(1) | 1.55 | % | 1.52 | % | 1.43 | % | |||||||||||||||||||||||||||||||||||
| Return on average equity (annualized) | 12.16 | % | 13.80 | % | 15.57 | % | |||||||||||||||||||||||||||||||||||
Core return on average equity (annualized)(1) | 13.63 | % | 13.80 | % | 12.56 | % | |||||||||||||||||||||||||||||||||||
Return on average tangible common equity (annualized)(1) | 13.62 | % | 15.51 | % | 17.49 | % | |||||||||||||||||||||||||||||||||||
Core return on average tangible common equity (annualized)(1) | 15.24 | % | 15.51 | % | 14.15 | % | |||||||||||||||||||||||||||||||||||
_______________
(1)Refer to Appendix for reconciliation of non-GAAP measures.
11
| COMPARATIVE FINANCIAL HIGHLIGHTS - Unaudited (continued) | ||||||||||||||||||||||||||
| Nine Months Ended | ||||||||||||||||||||||||||
| September 30, | ||||||||||||||||||||||||||
| (in thousands, except per share data) | 2026 | 2025 | $ Change | % Change | ||||||||||||||||||||||
| Earnings Summary | ||||||||||||||||||||||||||
| Interest income | $ | 210,221 | $ | 192,237 | $ | 17,984 | 9.4 | % | ||||||||||||||||||
| Interest expense | 56,816 | 46,524 | 10,292 | 22.1 | % | |||||||||||||||||||||
| Net interest income | 153,405 | 145,713 | 7,692 | 5.3 | % | |||||||||||||||||||||
| Provision for credit losses | 11,502 | 10,977 | 525 | 4.8 | % | |||||||||||||||||||||
| Provision for credit losses on unfunded commitments | 216 | 217 | (1) | (0.5) | % | |||||||||||||||||||||
| Noninterest income | 42,773 | 36,723 | 6,050 | 16.5 | % | |||||||||||||||||||||
| Noninterest expense | 132,589 | 115,979 | 16,610 | 14.3 | % | |||||||||||||||||||||
| Income before income taxes | 51,871 | 55,263 | (3,392) | (6.1) | % | |||||||||||||||||||||
| Income tax expense | 12,481 | 13,130 | (649) | (4.9) | % | |||||||||||||||||||||
| Net income | $ | 39,390 | $ | 42,133 | $ | (2,743) | (6.5) | % | ||||||||||||||||||
Core net income(1) | $ | 40,967 | $ | 41,253 | $ | (286) | (0.7) | % | ||||||||||||||||||
Pre-tax pre-provision net revenue ("PPNR") (1) | $ | 63,589 | $ | 66,457 | $ | (2,868) | (4.3) | % | ||||||||||||||||||
Core PPNR(1) | $ | 65,166 | $ | 65,200 | $ | (34) | (0.1) | % | ||||||||||||||||||
| Common Share Data | ||||||||||||||||||||||||||
| Earnings per share - Basic | $ | 2.42 | $ | 2.54 | $ | (0.12) | (4.7) | % | ||||||||||||||||||
| Earnings per share - Diluted | $ | 2.40 | $ | 2.50 | $ | (0.10) | (4.0) | % | ||||||||||||||||||
Core earnings per share - Diluted(1) | $ | 2.49 | $ | 2.45 | $ | 0.04 | 1.6 | % | ||||||||||||||||||
| Weighted average common shares - Basic | 16,309 | 16,611 | ||||||||||||||||||||||||
| Weighted average common shares - Diluted | 16,437 | 16,850 | ||||||||||||||||||||||||
| Return Ratios | ||||||||||||||||||||||||||
| Return on average assets (annualized) | 1.41 | % | 1.71 | % | ||||||||||||||||||||||
Core return on average assets (annualized)(1) | 1.47 | % | 1.67 | % | ||||||||||||||||||||||
| Return on average equity (annualized) | 12.66 | % | 15.10 | % | ||||||||||||||||||||||
Core return on average equity (annualized) (1) | 13.17 | % | 14.79 | % | ||||||||||||||||||||||
Return on average tangible common equity (annualized)(1) | 14.24 | % | 17.06 | % | ||||||||||||||||||||||
Core return on average tangible common equity (annualized)(1) | 14.80 | % | 16.70 | % | ||||||||||||||||||||||
_______________
(1)Refer to Appendix for reconciliation of non-GAAP measures.
12
| COMPARATIVE FINANCIAL HIGHLIGHTS - Unaudited (continued) | |||||||||||||||||||||||||||||||||||
| Quarter Ended | Quarter Ended | ||||||||||||||||||||||||||||||||||
| September 30, | June 30, | March 31, | December 31, | ||||||||||||||||||||||||||||||||
| (in thousands, except per share data) | 2026 | 2025 | % Change | 2026 | 2026 | 2025 | |||||||||||||||||||||||||||||
| Balance Sheet Highlights | |||||||||||||||||||||||||||||||||||
| Assets | $ | 3,802,553 | $ | 3,389,442 | 12.2 | % | $ | 3,889,938 | $ | 3,808,467 | $ | 3,606,207 | |||||||||||||||||||||||
| Investment securities available-for-sale | 214,486 | 232,640 | (7.8) | % | 219,947 | 230,525 | 230,083 | ||||||||||||||||||||||||||||
| Mortgage loans held for sale | 74,251 | 14,146 | 424.9 | % | 22,370 | 13,739 | 25,828 | ||||||||||||||||||||||||||||
Portfolio loans receivable (2) | 3,114,264 | 2,821,983 | 10.4 | % | 3,085,950 | 3,026,431 | 2,959,457 | ||||||||||||||||||||||||||||
| Allowance for credit losses | 55,493 | 53,045 | 4.6 | % | 54,431 | 54,680 | 54,660 | ||||||||||||||||||||||||||||
| Goodwill | 25,969 | 25,969 | — | % | 25,969 | 25,969 | 25,969 | ||||||||||||||||||||||||||||
| Intangible assets | 13,989 | 15,033 | (6.9) | % | 14,250 | 14,511 | 14,771 | ||||||||||||||||||||||||||||
| Deposits | 3,319,135 | 2,912,053 | 14.0 | % | 3,371,103 | 3,292,047 | 3,093,200 | ||||||||||||||||||||||||||||
| FHLB borrowings | — | 22,000 | (100.0) | % | 50,000 | 50,000 | 50,000 | ||||||||||||||||||||||||||||
| Other borrowed funds | 2,062 | 12,062 | (82.9) | % | 2,062 | 2,062 | 2,062 | ||||||||||||||||||||||||||||
| Total stockholders' equity | 431,450 | 394,770 | 9.3 | % | 422,205 | 408,859 | 401,757 | ||||||||||||||||||||||||||||
Tangible common equity (1) | 391,492 | 353,768 | 10.7 | % | 381,986 | 368,379 | 361,017 | ||||||||||||||||||||||||||||
| Common shares outstanding | 16,329 | 16,589 | (1.6) | % | 16,289 | 16,286 | 16,373 | ||||||||||||||||||||||||||||
| Book value per share | $ | 26.42 | $ | 23.80 | 11.0 | % | $ | 25.92 | $ | 25.10 | $ | 24.54 | |||||||||||||||||||||||
Tangible book value per share (1) | $ | 23.98 | $ | 21.33 | 12.4 | % | $ | 23.45 | $ | 22.62 | $ | 22.05 | |||||||||||||||||||||||
Dividends per share | $ | 0.14 | $ | 0.12 | 16.7 | % | $ | 0.12 | $ | 0.12 | $ | 0.12 | |||||||||||||||||||||||
(1)Refer to Appendix for reconciliation of non-GAAP measures.
(2)Loans are reflected net of deferred fees and costs.
13
| Consolidated Statements of Income (Unaudited) | |||||||||||||||||||||||||||||||||||||||||
| Three Months Ended | Nine Months Ended | ||||||||||||||||||||||||||||||||||||||||
| (in thousands) | September 30, 2026 | June 30, 2026 | March 31, 2026 | December 31, 2025 | September 30, 2025 | September 30, 2026 | September 30, 2025 | ||||||||||||||||||||||||||||||||||
| Interest income | |||||||||||||||||||||||||||||||||||||||||
| Loans, including fees | $ | 68,136 | $ | 65,362 | $ | 64,186 | $ | 64,933 | $ | 60,838 | $ | 197,684 | $ | 180,339 | |||||||||||||||||||||||||||
| Investment securities available-for-sale | 1,826 | 1,814 | 1,459 | 1,728 | 1,805 | 5,099 | 5,248 | ||||||||||||||||||||||||||||||||||
| Federal funds sold and other | 2,330 | 2,783 | 2,325 | 1,973 | 2,248 | 7,438 | 6,650 | ||||||||||||||||||||||||||||||||||
| Total interest income | 72,292 | 69,959 | 67,970 | 68,634 | 64,891 | 210,221 | 192,237 | ||||||||||||||||||||||||||||||||||
| Interest expense | |||||||||||||||||||||||||||||||||||||||||
| Deposits | 18,959 | 18,522 | 18,070 | 17,805 | 12,732 | 55,551 | 45,966 | ||||||||||||||||||||||||||||||||||
| Borrowed funds | 255 | 508 | 502 | 550 | 139 | 1,265 | 558 | ||||||||||||||||||||||||||||||||||
| Total interest expense | 19,214 | 19,030 | 18,572 | 18,355 | 12,871 | 56,816 | 46,524 | ||||||||||||||||||||||||||||||||||
| Net interest income | 53,078 | 50,929 | 49,398 | 50,279 | 52,020 | 153,405 | 145,713 | ||||||||||||||||||||||||||||||||||
| Provision for credit losses | 4,903 | 3,585 | 3,014 | 3,988 | 4,650 | 11,502 | 10,977 | ||||||||||||||||||||||||||||||||||
| Provision for (release of) credit losses on unfunded commitments | (54) | 65 | 205 | (29) | 217 | 216 | 217 | ||||||||||||||||||||||||||||||||||
| Net interest income after provision for credit losses | 48,229 | 47,279 | 46,179 | 46,320 | 47,153 | 141,687 | 134,519 | ||||||||||||||||||||||||||||||||||
| Noninterest income | |||||||||||||||||||||||||||||||||||||||||
| Service charges on deposits | 418 | 409 | 403 | 371 | 425 | 1,230 | 945 | ||||||||||||||||||||||||||||||||||
| Credit card fees | 4,520 | 4,395 | 4,692 | 4,837 | 4,509 | 13,607 | 12,529 | ||||||||||||||||||||||||||||||||||
| Mortgage banking revenue | 1,849 | 1,960 | 1,556 | 1,960 | 1,927 | 5,365 | 5,512 | ||||||||||||||||||||||||||||||||||
| Government lending revenue | 1,474 | 1,207 | 923 | — | 14 | 3,604 | 4,222 | ||||||||||||||||||||||||||||||||||
| Government loan servicing revenue | 5,073 | 5,303 | 4,345 | 4,036 | 4,265 | 14,721 | 11,477 | ||||||||||||||||||||||||||||||||||
| Loan servicing rights | 523 | 292 | 497 | 295 | 368 | 1,312 | 250 | ||||||||||||||||||||||||||||||||||
| Other income (loss) | 1,182 | 795 | 957 | 965 | (440) | 2,934 | 1,788 | ||||||||||||||||||||||||||||||||||
| Total noninterest income | 15,039 | 14,361 | 13,373 | 12,464 | 11,068 | 42,773 | 36,723 | ||||||||||||||||||||||||||||||||||
| Noninterest expenses | |||||||||||||||||||||||||||||||||||||||||
| Salaries and employee benefits | 21,116 | 20,067 | 20,317 | 17,914 | 17,728 | 61,500 | 54,255 | ||||||||||||||||||||||||||||||||||
| Occupancy and equipment | 4,144 | 3,942 | 3,562 | 2,638 | 2,849 | 11,648 | 8,754 | ||||||||||||||||||||||||||||||||||
| Professional fees | 4,919 | 4,125 | 4,965 | 4,294 | 2,131 | 14,009 | 6,665 | ||||||||||||||||||||||||||||||||||
| Data processing | 7,708 | 7,551 | 7,767 | 7,502 | 7,654 | 23,026 | 22,286 | ||||||||||||||||||||||||||||||||||
| Advertising | 1,566 | 1,816 | 1,466 | 1,398 | 1,714 | 4,848 | 4,864 | ||||||||||||||||||||||||||||||||||
| Loan processing | 543 | 1,475 | 1,383 | 1,152 | 1,114 | 3,401 | 2,836 | ||||||||||||||||||||||||||||||||||
| Merger-related expenses | 1,577 | — | — | — | 697 | 1,577 | 3,361 | ||||||||||||||||||||||||||||||||||
| Operational and other card fraud related losses | 930 | 690 | 690 | 750 | 923 | 2,310 | 2,759 | ||||||||||||||||||||||||||||||||||
| Regulatory assessment expenses | 930 | 925 | 941 | 858 | 740 | 2,796 | 2,513 | ||||||||||||||||||||||||||||||||||
| Other operating | 2,289 | 2,595 | 2,590 | 2,597 | 2,804 | 7,474 | 7,686 | ||||||||||||||||||||||||||||||||||
| Total noninterest expenses | 45,722 | 43,186 | 43,681 | 39,103 | 38,354 | 132,589 | 115,979 | ||||||||||||||||||||||||||||||||||
| Income before income taxes | 17,546 | 18,454 | 15,871 | 19,681 | 19,867 | 51,871 | 55,263 | ||||||||||||||||||||||||||||||||||
| Income tax expense | 4,424 | 4,204 | 3,853 | 4,644 | 4,802 | 12,481 | 13,130 | ||||||||||||||||||||||||||||||||||
| Net income | $ | 13,122 | $ | 14,250 | $ | 12,018 | $ | 15,037 | $ | 15,065 | $ | 39,390 | $ | 42,133 | |||||||||||||||||||||||||||
14
| Consolidated Balance Sheets | |||||||||||||||||||||||||||||
| (unaudited) | (unaudited) | (unaudited) | (audited) | (unaudited) | |||||||||||||||||||||||||
| (in thousands, except share data) | September 30, 2026 | June 30, 2026 | March 31, 2026 | December 31, 2025 | September 30, 2025 | ||||||||||||||||||||||||
| Assets | |||||||||||||||||||||||||||||
| Cash and due from banks | $ | 15,563 | $ | 24,771 | $ | 20,182 | $ | 30,894 | $ | 25,724 | |||||||||||||||||||
| Interest-bearing deposits at other financial institutions | 246,469 | 393,428 | 379,069 | 224,611 | 163,078 | ||||||||||||||||||||||||
| Federal funds sold | — | 60 | 60 | 60 | 59 | ||||||||||||||||||||||||
| Total cash and cash equivalents | 262,032 | 418,259 | 399,311 | 255,565 | 188,861 | ||||||||||||||||||||||||
| Investment securities available-for-sale | 214,486 | 219,947 | 230,525 | 230,083 | 232,640 | ||||||||||||||||||||||||
| Restricted investments | 6,360 | 8,707 | 8,691 | 8,397 | 7,057 | ||||||||||||||||||||||||
Loans held for sale(1) | 74,251 | 22,370 | 13,739 | 25,828 | 14,146 | ||||||||||||||||||||||||
| Portfolio loans receivable, net of deferred fees and costs | 3,114,264 | 3,085,950 | 3,026,431 | 2,959,457 | 2,821,983 | ||||||||||||||||||||||||
| Less allowance for credit losses | (55,493) | (54,431) | (54,680) | (54,660) | (53,045) | ||||||||||||||||||||||||
| Total portfolio loans held for investment, net | 3,058,771 | 3,031,519 | 2,971,751 | 2,904,797 | 2,768,938 | ||||||||||||||||||||||||
Premises and equipment, net(1) | 17,531 | 17,669 | 17,732 | 15,072 | 15,304 | ||||||||||||||||||||||||
| Accrued interest receivable | 23,189 | 19,429 | 16,795 | 16,695 | 19,011 | ||||||||||||||||||||||||
| Goodwill | 25,969 | 25,969 | 25,969 | 25,969 | 25,969 | ||||||||||||||||||||||||
| Intangible assets | 13,989 | 14,250 | 14,511 | 14,771 | 15,033 | ||||||||||||||||||||||||
| Loan servicing assets | 1,994 | 1,847 | 1,957 | 1,816 | 2,070 | ||||||||||||||||||||||||
| Deferred tax asset | 18,206 | 16,504 | 15,187 | 14,992 | 14,885 | ||||||||||||||||||||||||
| Bank owned life insurance | 46,654 | 46,260 | 45,871 | 45,488 | 45,105 | ||||||||||||||||||||||||
| Other assets | 39,121 | 47,208 | 46,428 | 46,734 | 40,423 | ||||||||||||||||||||||||
| Total assets | $ | 3,802,553 | $ | 3,889,938 | $ | 3,808,467 | $ | 3,606,207 | $ | 3,389,442 | |||||||||||||||||||
| Liabilities | |||||||||||||||||||||||||||||
| Deposits | |||||||||||||||||||||||||||||
| Noninterest-bearing | $ | 844,536 | $ | 897,363 | $ | 871,677 | $ | 852,741 | $ | 857,543 | |||||||||||||||||||
| Interest-bearing | 2,474,599 | 2,473,740 | 2,420,370 | 2,240,459 | 2,054,510 | ||||||||||||||||||||||||
Total deposits(1) | 3,319,135 | 3,371,103 | 3,292,047 | 3,093,200 | 2,912,053 | ||||||||||||||||||||||||
| Federal Home Loan Bank advances | — | 50,000 | 50,000 | 50,000 | 22,000 | ||||||||||||||||||||||||
| Other borrowed funds | 2,062 | 2,062 | 2,062 | 2,062 | 12,062 | ||||||||||||||||||||||||
| Accrued interest payable | 6,843 | 6,606 | 8,944 | 8,745 | 8,045 | ||||||||||||||||||||||||
| Other liabilities | 43,063 | 37,962 | 46,555 | 50,443 | 40,512 | ||||||||||||||||||||||||
| Total liabilities | 3,371,103 | 3,467,733 | 3,399,608 | 3,204,450 | 2,994,672 | ||||||||||||||||||||||||
| Stockholders' equity | |||||||||||||||||||||||||||||
| Common stock | 163 | 163 | 163 | 164 | 166 | ||||||||||||||||||||||||
| Additional paid-in capital | 114,557 | 113,217 | 112,268 | 114,604 | 121,707 | ||||||||||||||||||||||||
| Retained earnings | 325,944 | 315,103 | 302,808 | 292,749 | 279,693 | ||||||||||||||||||||||||
| Accumulated other comprehensive loss | (9,214) | (6,278) | (6,380) | (5,760) | (6,796) | ||||||||||||||||||||||||
| Total stockholders' equity | 431,450 | 422,205 | 408,859 | 401,757 | 394,770 | ||||||||||||||||||||||||
| Total liabilities and stockholders' equity | $ | 3,802,553 | $ | 3,889,938 | $ | 3,808,467 | $ | 3,606,207 | $ | 3,389,442 | |||||||||||||||||||
_______________
(1)Balances include held for sale transactions in connection with sale of Chicago branch.
15
The following tables show the average outstanding balance of each principal category of our assets, liabilities and stockholders’ equity, together with the average yields on our assets and the average costs of our liabilities for the periods indicated. Such yields and costs are calculated by dividing the annualized income or expense by the average daily balances of the corresponding assets or liabilities for the same period.
| Three Months Ended September 30, 2026 | Three Months Ended June 30, 2026 | Three Months Ended September 30, 2025 | |||||||||||||||||||||||||||||||||||||||||||||||||||
| Average Outstanding Balance | Interest Income/ Expense | Average Yield/ Rate(1) | Average Outstanding Balance | Interest Income/ Expense | Average Yield/ Rate(1) | Average Outstanding Balance | Interest Income/ Expense | Average Yield/ Rate(1) | |||||||||||||||||||||||||||||||||||||||||||||
| (in thousands) | |||||||||||||||||||||||||||||||||||||||||||||||||||||
| Assets | |||||||||||||||||||||||||||||||||||||||||||||||||||||
| Interest earning assets: | |||||||||||||||||||||||||||||||||||||||||||||||||||||
| Interest-bearing deposits | $ | 242,761 | $ | 2,218 | 3.62 | % | $ | 295,167 | $ | 2,646 | 3.60 | % | $ | 194,858 | $ | 2,139 | 4.36 | % | |||||||||||||||||||||||||||||||||||
| Federal funds sold | 22 | — | — | 60 | — | — | 59 | 1 | 5.79 | ||||||||||||||||||||||||||||||||||||||||||||
| Investment securities available-for-sale | 227,537 | 1,826 | 3.18 | 240,102 | 1,814 | 3.03 | 241,086 | 1,805 | 2.97 | ||||||||||||||||||||||||||||||||||||||||||||
| Restricted investments | 7,441 | 112 | 5.97 | 8,701 | 137 | 6.32 | 7,052 | 108 | 6.06 | ||||||||||||||||||||||||||||||||||||||||||||
Loans held for sale (2)(3) | 11,630 | 194 | 6.62 | 17,381 | 252 | 5.82 | 13,783 | 228 | 6.57 | ||||||||||||||||||||||||||||||||||||||||||||
Portfolio loans receivable(3)(4) | 3,135,648 | 67,942 | 8.60 | 3,058,476 | 65,110 | 8.54 | 2,789,815 | 60,610 | 8.62 | ||||||||||||||||||||||||||||||||||||||||||||
| Total interest earning assets | 3,625,039 | 72,292 | 7.91 | 3,619,887 | 69,959 | 7.75 | 3,246,653 | 64,891 | 7.93 | ||||||||||||||||||||||||||||||||||||||||||||
Noninterest earning assets(2) | 140,002 | 141,624 | 131,643 | ||||||||||||||||||||||||||||||||||||||||||||||||||
Total assets | $ | 3,765,041 | $ | 3,761,511 | $ | 3,378,296 | |||||||||||||||||||||||||||||||||||||||||||||||
Liabilities and Stockholders’ Equity | |||||||||||||||||||||||||||||||||||||||||||||||||||||
| Interest-bearing liabilities: | |||||||||||||||||||||||||||||||||||||||||||||||||||||
| Interest-bearing demand accounts | $ | 332,684 | 768 | 0.92 | $ | 346,671 | 816 | 0.94 | $ | 282,873 | 388 | 0.54 | |||||||||||||||||||||||||||||||||||||||||
| Savings | 22,479 | 115 | 2.03 | 17,790 | 70 | 1.58 | 12,887 | 15 | 0.47 | ||||||||||||||||||||||||||||||||||||||||||||
| Money market accounts | 1,375,162 | 11,389 | 3.29 | 1,315,061 | 10,797 | 3.29 | 985,106 | 8,650 | 3.48 | ||||||||||||||||||||||||||||||||||||||||||||
| Time deposits | 703,072 | 6,687 | 3.77 | 722,144 | 6,839 | 3.80 | 815,302 | 3,679 | 1.79 | ||||||||||||||||||||||||||||||||||||||||||||
| Borrowed funds | 25,051 | 255 | 4.04 | 52,062 | 508 | 3.91 | 34,062 | 139 | 1.62 | ||||||||||||||||||||||||||||||||||||||||||||
Total interest-bearing liabilities(2) | 2,458,448 | 19,214 | 3.10 | 2,453,728 | 19,030 | 3.11 | 2,130,230 | 12,871 | 2.40 | ||||||||||||||||||||||||||||||||||||||||||||
| Noninterest-bearing liabilities: | |||||||||||||||||||||||||||||||||||||||||||||||||||||
| Noninterest-bearing liabilities | 46,904 | 51,427 | 43,245 | ||||||||||||||||||||||||||||||||||||||||||||||||||
Noninterest-bearing deposits(2) | 831,739 | 842,312 | 820,899 | ||||||||||||||||||||||||||||||||||||||||||||||||||
Stockholders’ equity | 427,950 | 414,044 | 383,922 | ||||||||||||||||||||||||||||||||||||||||||||||||||
| Total liabilities and stockholders’ equity | $ | 3,765,041 | $ | 3,761,511 | $ | 3,378,296 | |||||||||||||||||||||||||||||||||||||||||||||||
| Net interest spread | 4.81 | % | 4.64 | % | 5.53 | % | |||||||||||||||||||||||||||||||||||||||||||||||
| Net interest income | $ | 53,078 | $ | 50,929 | $ | 52,020 | |||||||||||||||||||||||||||||||||||||||||||||||
Net interest margin(5) | 5.81 | % | 5.64 | % | 6.36 | % | |||||||||||||||||||||||||||||||||||||||||||||||
_______________
(1)Annualized.
(2)Balances include held for sale transactions in connection with sale of Chicago branch.
(3)Average balances includes nonaccrual loans. As of September 30, 2026, nonaccrual loans of $0.3 million were included in Loans held for sale and $56.4 million in Portfolio loans receivable.
(4)For the three months ended September 30, 2026, June 30, 2026, and September 30, 2025, Core Loan Yield was 6.83%, 6.77% and 6.74%, respectively.
(5)For the three months ended September 30, 2026, June 30, 2026, and September 30, 2025, Core Net Interest Margin was 4.18%, 4.04% and 4.66%, respectively.
16
| Nine Months Ended September 30, | |||||||||||||||||||||||||||||||||||
| 2026 | 2025 | ||||||||||||||||||||||||||||||||||
| Average Outstanding Balance | Interest Income/ Expense | Average Yield/ Rate(1) | Average Outstanding Balance | Interest Income/ Expense | Average Yield/ Rate(1) | ||||||||||||||||||||||||||||||
| (in thousands) | |||||||||||||||||||||||||||||||||||
| Assets | |||||||||||||||||||||||||||||||||||
| Interest earning assets: | |||||||||||||||||||||||||||||||||||
| Interest-bearing deposits | $ | 261,412 | $ | 7,063 | 3.61 | % | $ | 193,337 | $ | 6,342 | 4.39 | % | |||||||||||||||||||||||
| Federal funds sold | 47 | 1 | 2.84 | 59 | 2 | 4.24 | |||||||||||||||||||||||||||||
| Investment securities available-for-sale | 233,592 | 5,099 | 2.92 | 235,690 | 5,248 | 2.98 | |||||||||||||||||||||||||||||
| Restricted investments | 8,191 | 373 | 6.09 | 6,622 | 306 | 6.17 | |||||||||||||||||||||||||||||
Loans held for sale (2)(3) | 13,971 | 623 | 5.96 | 11,046 | 629 | 7.62 | |||||||||||||||||||||||||||||
Portfolio loans receivable(3)(4) | 3,067,904 | 197,062 | 8.59 | 2,719,834 | 179,710 | 8.83 | |||||||||||||||||||||||||||||
| Total interest earning assets | 3,585,117 | 210,221 | 7.84 | 3,166,588 | 192,237 | 8.12 | |||||||||||||||||||||||||||||
Noninterest earning assets(2) | 141,434 | 131,582 | |||||||||||||||||||||||||||||||||
| Total assets | $ | 3,726,551 | $ | 3,298,170 | |||||||||||||||||||||||||||||||
| Liabilities and Stockholders’ Equity | |||||||||||||||||||||||||||||||||||
| Interest-bearing liabilities: | |||||||||||||||||||||||||||||||||||
| Interest-bearing demand accounts | $ | 314,587 | $ | 1,998 | 0.85 | % | $ | 269,184 | $ | 1,147 | 0.57 | % | |||||||||||||||||||||||
| Savings | 18,022 | 214 | 1.59 | 13,044 | 49 | 0.51 | |||||||||||||||||||||||||||||
| Money market accounts | 1,293,968 | 31,666 | 3.27 | 927,044 | 24,071 | 3.47 | |||||||||||||||||||||||||||||
| Time deposits | 755,275 | 21,673 | 3.84 | 830,451 | 20,699 | 3.33 | |||||||||||||||||||||||||||||
| Borrowed funds | 42,959 | 1,265 | 3.94 | 34,062 | 558 | 2.19 | |||||||||||||||||||||||||||||
Total interest-bearing liabilities(2) | 2,424,811 | 56,816 | 3.13 | 2,073,785 | 46,524 | 3.00 | |||||||||||||||||||||||||||||
| Noninterest-bearing liabilities: | |||||||||||||||||||||||||||||||||||
| Noninterest-bearing liabilities | 54,081 | 48,374 | |||||||||||||||||||||||||||||||||
Noninterest-bearing deposits(2) | 831,811 | 802,991 | |||||||||||||||||||||||||||||||||
| Stockholders’ equity | 415,848 | 373,020 | |||||||||||||||||||||||||||||||||
| Total liabilities and stockholders’ equity | $ | 3,726,551 | $ | 3,298,170 | |||||||||||||||||||||||||||||||
| Net interest spread | 4.71 | % | 5.12 | % | |||||||||||||||||||||||||||||||
| Net interest income | $ | 153,405 | $ | 145,713 | |||||||||||||||||||||||||||||||
Net interest margin(5) | 5.72 | % | 6.15 | % | |||||||||||||||||||||||||||||||
_______________
(1)Annualized.
(2)Balances include held for sale transactions in connection with sale of Chicago branch.
(3)Includes nonaccrual loans.
(4)For the nine months ended September 30, 2026 and 2025, collectively. Core Loan Yield was 6.84% and 7.01%, respectively.
(5)For the nine months ended September 30, 2026 and 2025, collectively. Core Net Interest Margin was 4.12% and 4.48%, respectively.
17
The Company’s reportable segments represent business units with discrete financial information whose results are regularly reviewed by management. The four segments include Commercial Banking, OpenSky™ (the Company’s credit card division), Windsor Advantage™ and Capital Bank Home Loans (the Company’s mortgage loan division).
The following schedules reported internally for performance assessment by the chief operating decision maker presents financial information for each reportable segment for the periods indicated. Total assets are presented as of September 30, 2026, June 30, 2026, and September 30, 2025.
| Segments | |||||||||||||||||||||||||||||||||||
| For the three months ended September 30, 2026 | |||||||||||||||||||||||||||||||||||
| (in thousands) | Commercial Bank | OpenSky™ | Windsor Advantage™ | CBHL | Consolidated | ||||||||||||||||||||||||||||||
| Interest income | $ | 55,580 | $ | 16,517 | $ | — | $ | 195 | $ | 72,292 | |||||||||||||||||||||||||
| Interest expense | 19,128 | — | — | 86 | 19,214 | ||||||||||||||||||||||||||||||
| Net interest income | 36,452 | 16,517 | — | 109 | 53,078 | ||||||||||||||||||||||||||||||
| Provision for credit losses | 833 | 4,070 | — | — | 4,903 | ||||||||||||||||||||||||||||||
| Release of credit losses on unfunded commitments | (54) | — | — | — | (54) | ||||||||||||||||||||||||||||||
| Net interest income after provision | 35,673 | 12,447 | — | 109 | 48,229 | ||||||||||||||||||||||||||||||
| Noninterest income | |||||||||||||||||||||||||||||||||||
| Service charges on deposits | 418 | — | — | — | 418 | ||||||||||||||||||||||||||||||
| Credit card fees | — | 4,520 | — | — | 4,520 | ||||||||||||||||||||||||||||||
| Mortgage banking revenue | 490 | — | — | 1,359 | 1,849 | ||||||||||||||||||||||||||||||
| Government lending revenue | 1,474 | — | — | — | 1,474 | ||||||||||||||||||||||||||||||
Government loan servicing revenue(1) | (1,665) | — | 6,738 | — | 5,073 | ||||||||||||||||||||||||||||||
| Loan servicing rights | 523 | — | — | — | 523 | ||||||||||||||||||||||||||||||
| Other income | 877 | 31 | 5 | 269 | 1,182 | ||||||||||||||||||||||||||||||
| Total noninterest income | 2,117 | 4,551 | 6,743 | 1,628 | 15,039 | ||||||||||||||||||||||||||||||
| Noninterest expenses | |||||||||||||||||||||||||||||||||||
Salaries and employee benefits | 11,879 | 4,319 | 3,095 | 1,823 | 21,116 | ||||||||||||||||||||||||||||||
| Occupancy and equipment | 2,441 | 1,064 | 436 | 203 | 4,144 | ||||||||||||||||||||||||||||||
| Professional fees | 2,469 | 1,736 | 287 | 427 | 4,919 | ||||||||||||||||||||||||||||||
| Data processing | 442 | 7,152 | 62 | 52 | 7,708 | ||||||||||||||||||||||||||||||
| Advertising | 1,183 | 143 | 123 | 117 | 1,566 | ||||||||||||||||||||||||||||||
| Loan processing | 266 | 5 | 1 | 271 | 543 | ||||||||||||||||||||||||||||||
| Merger-related expenses | 1,577 | — | — | — | 1,577 | ||||||||||||||||||||||||||||||
| Operational and other card fraud related losses | 73 | 812 | 23 | 22 | 930 | ||||||||||||||||||||||||||||||
| Regulatory assessment expenses | 563 | 232 | 70 | 65 | 930 | ||||||||||||||||||||||||||||||
| Other operating | 1,332 | 262 | 563 | 132 | 2,289 | ||||||||||||||||||||||||||||||
| Total noninterest expenses | 22,225 | 15,725 | 4,660 | 3,112 | 45,722 | ||||||||||||||||||||||||||||||
| Net income (loss) before taxes | $ | 15,565 | $ | 1,273 | $ | 2,083 | $ | (1,375) | $ | 17,546 | |||||||||||||||||||||||||
| Total assets | $ | 3,607,589 | $ | 144,462 | $ | 28,508 | $ | 21,994 | $ | 3,802,553 | |||||||||||||||||||||||||
_______________
(1)Gross government loan servicing revenue totaled $6.7 million, including $1.7 million of servicing fees earned from the Commercial Bank by WindsorTM, for the three months ended September 30, 2026.
18
| Segments | |||||||||||||||||||||||||||||||||||
| For the three months ended June 30, 2026 | |||||||||||||||||||||||||||||||||||
| (in thousands) | Commercial Bank | OpenSky™ | Windsor Advantage™ | CBHL | Consolidated | ||||||||||||||||||||||||||||||
| Interest income | $ | 53,712 | $ | 15,995 | $ | — | $ | 252 | $ | 69,959 | |||||||||||||||||||||||||
| Interest expense | 18,894 | — | — | 136 | 19,030 | ||||||||||||||||||||||||||||||
| Net interest income | 34,818 | 15,995 | — | 116 | 50,929 | ||||||||||||||||||||||||||||||
| Provision for (release of) credit losses | (432) | 4,017 | — | — | 3,585 | ||||||||||||||||||||||||||||||
| Provision for credit losses on unfunded commitments | 65 | — | — | — | 65 | ||||||||||||||||||||||||||||||
| Net interest income after provision | 35,185 | 11,978 | — | 116 | 47,279 | ||||||||||||||||||||||||||||||
| Noninterest income | |||||||||||||||||||||||||||||||||||
| Service charges on deposits | 409 | — | — | — | 409 | ||||||||||||||||||||||||||||||
| Credit card fees | — | 4,395 | — | — | 4,395 | ||||||||||||||||||||||||||||||
| Mortgage banking revenue | 278 | — | — | 1,682 | 1,960 | ||||||||||||||||||||||||||||||
| Government lending revenue | 1,207 | — | — | — | 1,207 | ||||||||||||||||||||||||||||||
Government loan servicing revenue(1) | (1,256) | — | 6,559 | — | 5,303 | ||||||||||||||||||||||||||||||
| Loan servicing rights | 292 | — | — | — | 292 | ||||||||||||||||||||||||||||||
| Other income | 618 | 30 | — | 147 | 795 | ||||||||||||||||||||||||||||||
| Total noninterest income | 1,548 | 4,425 | 6,559 | 1,829 | 14,361 | ||||||||||||||||||||||||||||||
| Noninterest expenses | |||||||||||||||||||||||||||||||||||
Salaries and employee benefits | 12,048 | 3,792 | 2,625 | 1,602 | 20,067 | ||||||||||||||||||||||||||||||
| Occupancy and equipment | 2,315 | 1,047 | 391 | 189 | 3,942 | ||||||||||||||||||||||||||||||
| Professional fees | 2,233 | 1,228 | 271 | 393 | 4,125 | ||||||||||||||||||||||||||||||
| Data processing | 452 | 6,983 | 67 | 49 | 7,551 | ||||||||||||||||||||||||||||||
| Advertising | 765 | 598 | 297 | 156 | 1,816 | ||||||||||||||||||||||||||||||
| Loan processing | 927 | 271 | 9 | 268 | 1,475 | ||||||||||||||||||||||||||||||
| Merger-related expenses | — | — | — | — | — | ||||||||||||||||||||||||||||||
| Operational and other card fraud related losses | 72 | 618 | — | — | 690 | ||||||||||||||||||||||||||||||
| Regulatory assessment expenses | 583 | 214 | 64 | 64 | 925 | ||||||||||||||||||||||||||||||
| Other operating | 1,277 | 639 | 558 | 121 | 2,595 | ||||||||||||||||||||||||||||||
| Total noninterest expenses | 20,672 | 15,390 | 4,282 | 2,842 | 43,186 | ||||||||||||||||||||||||||||||
| Net income (loss) before taxes | $ | 16,061 | $ | 1,013 | $ | 2,277 | $ | (897) | $ | 18,454 | |||||||||||||||||||||||||
| Total assets | $ | 3,689,273 | $ | 143,716 | $ | 27,818 | $ | 29,131 | $ | 3,889,938 | |||||||||||||||||||||||||
_______________
(1) Gross government loan servicing revenue totaled $6.6 million, including $1.3 million of servicing fees earned from the Commercial Bank by WindsorTM, for the three months ended June 30, 2026.
19
| Segments | |||||||||||||||||||||||||||||||||||
| For the three months ended September 30, 2025 | |||||||||||||||||||||||||||||||||||
| (in thousands) | Commercial Bank | OpenSky™ | Windsor Advantage™ | CBHL | Consolidated | ||||||||||||||||||||||||||||||
Interest income(2) | $ | 49,035 | $ | 15,628 | $ | — | $ | 228 | $ | 64,891 | |||||||||||||||||||||||||
| Interest expense | 12,768 | — | — | 103 | 12,871 | ||||||||||||||||||||||||||||||
| Net interest income | 36,267 | 15,628 | — | 125 | 52,020 | ||||||||||||||||||||||||||||||
| Provision for credit losses | 1,852 | 2,798 | — | — | 4,650 | ||||||||||||||||||||||||||||||
| Provision for credit losses on unfunded commitments | 217 | — | — | — | 217 | ||||||||||||||||||||||||||||||
| Net interest income after provision | 34,198 | 12,830 | — | 125 | 47,153 | ||||||||||||||||||||||||||||||
| Noninterest income | |||||||||||||||||||||||||||||||||||
| Service charges on deposits | 425 | — | — | — | 425 | ||||||||||||||||||||||||||||||
| Credit card fees | — | 4,509 | — | — | 4,509 | ||||||||||||||||||||||||||||||
| Mortgage banking revenue | 315 | — | — | 1,612 | 1,927 | ||||||||||||||||||||||||||||||
| Government lending revenue | 14 | — | — | — | 14 | ||||||||||||||||||||||||||||||
Government loan servicing revenue(1) | (1,074) | — | 5,339 | — | 4,265 | ||||||||||||||||||||||||||||||
| Loan servicing rights | 368 | — | — | — | 368 | ||||||||||||||||||||||||||||||
| Other income (loss) | (557) | (33) | — | 150 | (440) | ||||||||||||||||||||||||||||||
| Total noninterest income | (509) | 4,476 | 5,339 | 1,762 | 11,068 | ||||||||||||||||||||||||||||||
| Noninterest expenses | |||||||||||||||||||||||||||||||||||
Salaries and employee benefits | 10,559 | 3,271 | 2,455 | 1,443 | 17,728 | ||||||||||||||||||||||||||||||
| Occupancy and equipment | 1,635 | 632 | 416 | 166 | 2,849 | ||||||||||||||||||||||||||||||
| Professional fees | 1,079 | 571 | 198 | 283 | 2,131 | ||||||||||||||||||||||||||||||
| Data processing | 350 | 7,154 | 97 | 53 | 7,654 | ||||||||||||||||||||||||||||||
| Advertising | 694 | 833 | 76 | 111 | 1,714 | ||||||||||||||||||||||||||||||
| Loan processing | 740 | 15 | 67 | 292 | 1,114 | ||||||||||||||||||||||||||||||
| Merger-related expenses | 697 | — | — | — | 697 | ||||||||||||||||||||||||||||||
| Operational and other card fraud related losses | — | 923 | — | — | 923 | ||||||||||||||||||||||||||||||
| Regulatory assessment expenses | 788 | (30) | (11) | (7) | 740 | ||||||||||||||||||||||||||||||
| Other operating | 1,493 | 587 | 614 | 110 | 2,804 | ||||||||||||||||||||||||||||||
| Total noninterest expenses | 18,035 | 13,956 | 3,912 | 2,451 | 38,354 | ||||||||||||||||||||||||||||||
| Net income (loss) before taxes | $ | 15,654 | $ | 3,350 | $ | 1,427 | $ | (564) | $ | 19,867 | |||||||||||||||||||||||||
| Total assets | $ | 3,213,222 | $ | 134,422 | $ | 21,743 | $ | 20,055 | $ | 3,389,442 | |||||||||||||||||||||||||
(1) Gross government loan servicing revenue totaled $5.3 million, including $1.1 million of servicing fees earned from the Commercial Bank by WindsorTM, for the three months ended September 30, 2025.
(2) Interest income of $49.0 million for the Commercial Bank includes the $1.3 million Interest Income Adjustment.
20
| Segments | |||||||||||||||||||||||||||||||||||
| For the nine months ended September 30, 2026 | |||||||||||||||||||||||||||||||||||
| (in thousands) | Commercial Bank | OpenSky™ | Windsor Advantage™ | CBHL | Consolidated | ||||||||||||||||||||||||||||||
| Interest income | $ | 162,024 | $ | 47,573 | $ | — | $ | 624 | $ | 210,221 | |||||||||||||||||||||||||
| Interest expense | 56,494 | — | — | 322 | 56,816 | ||||||||||||||||||||||||||||||
| Net interest income | 105,530 | 47,573 | — | 302 | 153,405 | ||||||||||||||||||||||||||||||
| Provision for credit losses | 745 | 10,757 | — | — | 11,502 | ||||||||||||||||||||||||||||||
| Provision for credit losses on unfunded commitments | 216 | — | — | — | 216 | ||||||||||||||||||||||||||||||
| Net interest income after provision | 104,569 | 36,816 | — | 302 | 141,687 | ||||||||||||||||||||||||||||||
| Noninterest income | |||||||||||||||||||||||||||||||||||
| Service charges on deposits | 1,230 | — | — | — | 1,230 | ||||||||||||||||||||||||||||||
| Credit card fees | — | 13,607 | — | — | 13,607 | ||||||||||||||||||||||||||||||
| Mortgage banking revenue | 1,184 | — | — | 4,181 | 5,365 | ||||||||||||||||||||||||||||||
| Government lending revenue | 3,604 | — | — | — | 3,604 | ||||||||||||||||||||||||||||||
Government loan servicing revenue(1) | (4,183) | — | 18,904 | — | 14,721 | ||||||||||||||||||||||||||||||
| Loan servicing rights | 1,312 | — | — | — | 1,312 | ||||||||||||||||||||||||||||||
| Other income | 2,202 | 73 | 5 | 654 | 2,934 | ||||||||||||||||||||||||||||||
| Total noninterest income | 5,349 | 13,680 | 18,909 | 4,835 | 42,773 | ||||||||||||||||||||||||||||||
| Noninterest expenses | |||||||||||||||||||||||||||||||||||
Salaries and employee benefits | 36,017 | 11,998 | 8,384 | 5,101 | 61,500 | ||||||||||||||||||||||||||||||
| Occupancy and equipment | 6,626 | 3,229 | 1,219 | 574 | 11,648 | ||||||||||||||||||||||||||||||
| Professional fees | 7,170 | 4,825 | 836 | 1,178 | 14,009 | ||||||||||||||||||||||||||||||
| Data processing | 1,439 | 21,242 | 188 | 157 | 23,026 | ||||||||||||||||||||||||||||||
| Advertising | 2,666 | 1,333 | 480 | 369 | 4,848 | ||||||||||||||||||||||||||||||
| Loan processing | 2,269 | 323 | 32 | 777 | 3,401 | ||||||||||||||||||||||||||||||
| Merger-related expenses | 1,577 | — | — | — | 1,577 | ||||||||||||||||||||||||||||||
| Operational and other card fraud related losses | 210 | 2,055 | 23 | 22 | 2,310 | ||||||||||||||||||||||||||||||
| Regulatory assessment expenses | 1,744 | 661 | 200 | 191 | 2,796 | ||||||||||||||||||||||||||||||
| Other operating | 3,749 | 1,616 | 1,726 | 383 | 7,474 | ||||||||||||||||||||||||||||||
| Total noninterest expenses | 63,467 | 47,282 | 13,088 | 8,752 | 132,589 | ||||||||||||||||||||||||||||||
| Net income (loss) before taxes | $ | 46,451 | $ | 3,214 | $ | 5,821 | $ | (3,615) | $ | 51,871 | |||||||||||||||||||||||||
| Total assets | $ | 3,607,589 | $ | 144,462 | $ | 28,508 | $ | 21,994 | $ | 3,802,553 | |||||||||||||||||||||||||
_______________
(1) Gross government loan servicing revenue totaled $18.9 million, including $4.2 million of servicing fees earned from the Commercial Bank by WindsorTM, for the nine months ended September 30, 2026.
21
| Segments | |||||||||||||||||||||||||||||||||||
| For the nine months ended September 30, 2025 | |||||||||||||||||||||||||||||||||||
| (in thousands) | Commercial Bank | OpenSky™ | Windsor Advantage™ | CBHL | Consolidated | ||||||||||||||||||||||||||||||
| Interest income | $ | 147,128 | $ | 44,566 | $ | — | $ | 543 | $ | 192,237 | |||||||||||||||||||||||||
| Interest expense | 46,273 | — | — | 251 | 46,524 | ||||||||||||||||||||||||||||||
| Net interest income | 100,855 | 44,566 | — | 292 | 145,713 | ||||||||||||||||||||||||||||||
| Provision for credit losses | 3,457 | 7,520 | — | — | 10,977 | ||||||||||||||||||||||||||||||
| Provision for credit losses on unfunded commitments | 217 | — | — | — | 217 | ||||||||||||||||||||||||||||||
| Net interest income after provision | 97,181 | 37,046 | — | 292 | 134,519 | ||||||||||||||||||||||||||||||
| Noninterest income | |||||||||||||||||||||||||||||||||||
| Service charges on deposits | 945 | — | — | — | 945 | ||||||||||||||||||||||||||||||
| Credit card fees | — | 12,529 | — | — | 12,529 | ||||||||||||||||||||||||||||||
| Mortgage banking revenue | 1,043 | — | — | 4,469 | 5,512 | ||||||||||||||||||||||||||||||
| Government lending revenue | 4,222 | — | — | — | 4,222 | ||||||||||||||||||||||||||||||
Government loan servicing revenue(1) | (3,164) | — | 14,641 | — | 11,477 | ||||||||||||||||||||||||||||||
| Loan servicing rights | 250 | — | — | — | 250 | ||||||||||||||||||||||||||||||
| Other income | 1,215 | 3 | — | 570 | 1,788 | ||||||||||||||||||||||||||||||
| Total noninterest income | 4,511 | 12,532 | 14,641 | 5,039 | 36,723 | ||||||||||||||||||||||||||||||
| Noninterest expenses | |||||||||||||||||||||||||||||||||||
Salaries and employee benefits | 32,275 | 10,019 | 7,370 | 4,591 | 54,255 | ||||||||||||||||||||||||||||||
| Occupancy and equipment | 5,115 | 1,693 | 1,495 | 451 | 8,754 | ||||||||||||||||||||||||||||||
| Professional fees | 3,802 | 1,714 | 389 | 760 | 6,665 | ||||||||||||||||||||||||||||||
| Data processing | 1,244 | 20,633 | 283 | 126 | 22,286 | ||||||||||||||||||||||||||||||
| Advertising | 2,207 | 2,177 | 215 | 265 | 4,864 | ||||||||||||||||||||||||||||||
| Loan processing | 1,867 | 58 | 128 | 783 | 2,836 | ||||||||||||||||||||||||||||||
| Merger-related expenses | 3,361 | — | — | — | 3,361 | ||||||||||||||||||||||||||||||
| Operational and other card fraud related losses | 131 | 2,628 | — | — | 2,759 | ||||||||||||||||||||||||||||||
| Regulatory assessment expenses | 2,513 | — | — | — | 2,513 | ||||||||||||||||||||||||||||||
| Other operating | 4,719 | 1,441 | 1,222 | 304 | 7,686 | ||||||||||||||||||||||||||||||
| Total noninterest expenses | 57,234 | 40,363 | 11,102 | 7,280 | 115,979 | ||||||||||||||||||||||||||||||
| Net income (loss) before taxes | $ | 44,458 | $ | 9,215 | $ | 3,539 | $ | (1,949) | $ | 55,263 | |||||||||||||||||||||||||
| Total assets | $ | 3,213,222 | $ | 134,422 | $ | 21,743 | $ | 20,055 | $ | 3,389,442 | |||||||||||||||||||||||||
(1) Gross government loan servicing revenue totaled $14.6 million, including $3.2 million of servicing fees earned from the Commercial Bank by WindsorTM, for the nine months ended September 30, 2025.
22
| HISTORICAL FINANCIAL HIGHLIGHTS - Unaudited | ||||||||||||||||||||||||||||||||
| Quarter Ended | ||||||||||||||||||||||||||||||||
| (in thousands, except per share data) | September 30, 2026 | June 30, 2026 | March 31, 2026 | December 31, 2025 | September 30, 2025 | |||||||||||||||||||||||||||
| Earnings: | ||||||||||||||||||||||||||||||||
| Net income | $ | 13,122 | $ | 14,250 | $ | 12,018 | $ | 15,037 | $ | 15,065 | ||||||||||||||||||||||
| Earnings per common share, diluted | 0.80 | 0.87 | 0.73 | 0.91 | 0.89 | |||||||||||||||||||||||||||
| Net interest margin | 5.81 | % | 5.64 | % | 5.71 | % | 5.94 | % | 6.36 | % | ||||||||||||||||||||||
Core net interest margin(2) | 4.18 | % | 4.04 | % | 4.15 | % | 4.19 | % | 4.66 | % | ||||||||||||||||||||||
Return on average assets(1) | 1.38 | % | 1.52 | % | 1.33 | % | 1.71 | % | 1.77 | % | ||||||||||||||||||||||
Return on average equity(1) | 12.16 | % | 13.80 | % | 12.03 | % | 15.23 | % | 15.57 | % | ||||||||||||||||||||||
| Efficiency ratio | 67.12 | % | 66.14 | % | 69.59 | % | 62.32 | % | 60.79 | % | ||||||||||||||||||||||
| Balance Sheet: | ||||||||||||||||||||||||||||||||
| Total portfolio loans receivable, net deferred fees | $ | 3,114,264 | $ | 3,085,950 | $ | 3,026,431 | $ | 2,959,457 | $ | 2,821,983 | ||||||||||||||||||||||
| Total deposits | 3,319,135 | 3,371,103 | 3,292,047 | 3,093,200 | 2,912,053 | |||||||||||||||||||||||||||
| Total assets | 3,802,553 | 3,889,938 | 3,808,467 | 3,606,207 | 3,389,442 | |||||||||||||||||||||||||||
| Total stockholders' equity | 431,450 | 422,205 | 408,859 | 401,757 | 394,770 | |||||||||||||||||||||||||||
| Total average portfolio loans receivable, net deferred fees | 3,135,648 | 3,058,476 | 3,008,187 | 2,902,033 | 2,789,815 | |||||||||||||||||||||||||||
| Total average deposits | 3,265,136 | 3,243,978 | 3,130,392 | 2,992,784 | 2,917,067 | |||||||||||||||||||||||||||
| Portfolio loans-to-deposit ratio (period-end balances) | 93.83 | % | 91.54 | % | 91.93 | % | 95.68 | % | 96.91 | % | ||||||||||||||||||||||
| Portfolio loans-to-deposit ratio (average balances) | 96.03 | % | 94.28 | % | 96.10 | % | 96.97 | % | 95.64 | % | ||||||||||||||||||||||
| Asset Quality Ratios: | ||||||||||||||||||||||||||||||||
| Nonperforming assets to total assets | 1.59 | % | 1.56 | % | 1.56 | % | 1.62 | % | 1.54 | % | ||||||||||||||||||||||
| Nonperforming loans to total loans | 1.82 | % | 1.85 | % | 1.83 | % | 1.84 | % | 1.85 | % | ||||||||||||||||||||||
Net charge-offs to average portfolio loans (1) | 0.49 | % | 0.50 | % | 0.40 | % | 0.32 | % | 0.35 | % | ||||||||||||||||||||||
| Allowance for credit losses to total loans | 1.78 | % | 1.76 | % | 1.81 | % | 1.85 | % | 1.88 | % | ||||||||||||||||||||||
| Allowance for credit losses to non-performing loans | 97.94 | % | 95.51 | % | 98.67 | % | 100.44 | % | 101.53 | % | ||||||||||||||||||||||
| Bank Capital Ratios: | ||||||||||||||||||||||||||||||||
Total risk based capital ratio(3) | 12.52 | % | 12.60 | % | 12.52 | % | 12.60 | % | 12.95 | % | ||||||||||||||||||||||
Tier-1 risk based capital ratio(3) | 11.26 | % | 11.34 | % | 11.26 | % | 11.34 | % | 11.69 | % | ||||||||||||||||||||||
Leverage ratio(3) | 9.15 | % | 8.97 | % | 9.00 | % | 9.24 | % | 9.34 | % | ||||||||||||||||||||||
Common Equity Tier-1 capital ratio(3) | 11.26 | % | 11.34 | % | 11.26 | % | 11.34 | % | 11.69 | % | ||||||||||||||||||||||
Tangible common equity(3) | 9.34 | % | 9.06 | % | 8.40 | % | 8.75 | % | 9.06 | % | ||||||||||||||||||||||
| Holding Company Capital Ratios: | ||||||||||||||||||||||||||||||||
Total risk based capital ratio(3) | 14.58 | % | 14.49 | % | 14.25 | % | 14.31 | % | 15.25 | % | ||||||||||||||||||||||
Tier-1 risk based capital ratio(3) | 13.32 | % | 13.23 | % | 12.99 | % | 13.05 | % | 13.62 | % | ||||||||||||||||||||||
Leverage ratio(3) | 10.84 | % | 10.51 | % | 10.48 | % | 10.71 | % | 10.98 | % | ||||||||||||||||||||||
Common Equity Tier-1 capital ratio(3) | 13.25 | % | 13.16 | % | 12.92 | % | 12.98 | % | 13.54 | % | ||||||||||||||||||||||
Tangible common equity(3) | 11.02 | % | 10.54 | % | 9.73 | % | 10.07 | % | 10.60 | % | ||||||||||||||||||||||
_______________
(1)Annualized.
(2)Refer to Appendix for reconciliation of non-GAAP measures.
(3)Estimated ratio at September 30, 2026.
23
| HISTORICAL FINANCIAL HIGHLIGHTS - Unaudited (continued) | ||||||||||||||||||||||||||||||||
| Quarter Ended | ||||||||||||||||||||||||||||||||
| (in thousands, except per share data) | September 30, 2026 | June 30, 2026 | March 31, 2026 | December 31, 2025 | September 30, 2025 | |||||||||||||||||||||||||||
| Composition of Loans: | ||||||||||||||||||||||||||||||||
| Commercial real estate, non owner-occupied | $ | 545,612 | $ | 561,805 | $ | 522,498 | $ | 533,141 | $ | 509,878 | ||||||||||||||||||||||
| Commercial real estate, owner-occupied | 419,186 | 424,109 | 428,632 | 418,701 | 442,827 | |||||||||||||||||||||||||||
| Residential real estate | 784,220 | 797,745 | 795,505 | 765,808 | 740,060 | |||||||||||||||||||||||||||
| Construction real estate | 380,688 | 370,710 | 365,706 | 359,566 | 344,290 | |||||||||||||||||||||||||||
| Commercial and industrial | 774,297 | 731,575 | 730,576 | 698,289 | 619,148 | |||||||||||||||||||||||||||
| Lender finance | 55,601 | 50,020 | 43,775 | 41,421 | 31,883 | |||||||||||||||||||||||||||
| Business equity lines of credit | 4,355 | 4,930 | 4,170 | 3,818 | 2,931 | |||||||||||||||||||||||||||
Credit card, net of reserve(4) | 149,184 | 145,266 | 134,789 | 142,397 | 136,483 | |||||||||||||||||||||||||||
| Other consumer loans | 5,539 | 3,772 | 4,779 | 1,930 | 2,010 | |||||||||||||||||||||||||||
| Portfolio loans receivable | $ | 3,118,682 | $ | 3,089,932 | $ | 3,030,430 | $ | 2,965,071 | $ | 2,829,510 | ||||||||||||||||||||||
| Deferred origination fees, net | (4,418) | (3,982) | (3,999) | (5,614) | (7,527) | |||||||||||||||||||||||||||
| Portfolio loans receivable, net | $ | 3,114,264 | $ | 3,085,950 | $ | 3,026,431 | $ | 2,959,457 | $ | 2,821,983 | ||||||||||||||||||||||
| Composition of Deposits: | ||||||||||||||||||||||||||||||||
| Noninterest-bearing | $ | 844,536 | $ | 897,363 | $ | 871,677 | $ | 852,741 | $ | 857,543 | ||||||||||||||||||||||
| Interest-bearing demand | 323,139 | 391,544 | 341,723 | 257,233 | 275,767 | |||||||||||||||||||||||||||
| Savings | 30,538 | 23,077 | 21,471 | 11,679 | 12,835 | |||||||||||||||||||||||||||
| Money markets | 1,379,580 | 1,390,778 | 1,276,034 | 1,105,183 | 989,159 | |||||||||||||||||||||||||||
| Customer time deposits | 410,479 | 437,358 | 478,085 | 489,687 | 539,207 | |||||||||||||||||||||||||||
| Brokered time deposits | 330,863 | 230,983 | 303,057 | 376,677 | 237,542 | |||||||||||||||||||||||||||
| Total deposits | $ | 3,319,135 | $ | 3,371,103 | $ | 3,292,047 | $ | 3,093,200 | $ | 2,912,053 | ||||||||||||||||||||||
| Capital Bank Home Loan Metrics: | ||||||||||||||||||||||||||||||||
| Origination of loans held for sale | $ | 75,348 | $ | 106,885 | $ | 72,933 | $ | 107,283 | $ | 80,651 | ||||||||||||||||||||||
| Mortgage loans sold | 47,911 | 87,059 | 52,423 | 82,998 | 66,409 | |||||||||||||||||||||||||||
| Gain on sale of loans | 1,404 | 2,362 | 1,496 | 2,145 | 1,698 | |||||||||||||||||||||||||||
| Purchase volume as a % of originations | 90.50 | % | 86.14 | % | 73.15 | % | 72.77 | % | 92.32 | % | ||||||||||||||||||||||
Gain on sale as a % of loans sold(5) | 2.93 | % | 2.71 | % | 2.85 | % | 2.58 | % | 2.56 | % | ||||||||||||||||||||||
| Mortgage commissions | $ | 591 | $ | 947 | $ | 594 | $ | 899 | $ | 656 | ||||||||||||||||||||||
OpenSky™ Portfolio Metrics: | ||||||||||||||||||||||||||||||||
| Open customer accounts | 575,841 | 588,594 | 588,190 | 585,492 | 587,641 | |||||||||||||||||||||||||||
| Secured credit card loans, gross | $ | 93,672 | $ | 96,026 | $ | 90,021 | $ | 97,313 | $ | 98,793 | ||||||||||||||||||||||
| Unsecured credit card loans, gross | 57,589 | 51,234 | 46,574 | 47,131 | 39,576 | |||||||||||||||||||||||||||
| Noninterest secured credit card deposits | 162,354 | 166,174 | 165,506 | 163,184 | 166,874 | |||||||||||||||||||||||||||
_______________
(4)Credit card loans are presented net of reserve for interest and fees.
(5)Gain on sale percentage is calculated as gain on sale of loans divided by mortgage loans sold.
24
Appendix
Reconciliation of Non-GAAP Measures
The Company has presented the following non-GAAP (U.S. Generally Accepted Accounting Principles) financial measures because it believes that these measures provide useful and comparative information to assess trends in the Company’s results of operations and financial condition. Presentation of these non-GAAP financial measures is consistent with how the Company evaluates its performance internally and these non-GAAP financial measures are frequently used by securities analysts, investors and other interested parties in the evaluation of companies in the Company’s industry. Investors should recognize that the Company’s presentation of these non-GAAP financial measures might not be comparable to similarly-titled measures of other companies. These non-GAAP financial measures should not be considered a substitute for GAAP basis measures and the Company strongly encourages a review of its condensed consolidated financial statements in their entirety.
25
Appendix
Reconciliation of Non-GAAP Measures
| Core Earnings Metrics | Quarter Ended | ||||||||||||||||||||||||||||
| (in thousands, except per share data) | September 30, 2026 | June 30, 2026 | March 31, 2026 | December 31, 2025 | September 30, 2025 | ||||||||||||||||||||||||
| Net Income | $ | 13,122 | $ | 14,250 | $ | 12,018 | $ | 15,037 | $ | 15,065 | |||||||||||||||||||
| Deduct: Income from the Call of Brokered Time Deposits, Net of Tax | — | — | — | — | (3,489) | ||||||||||||||||||||||||
| Add: Merger-Related Expenses, Net of Tax | 1,577 | — | — | — | 575 | ||||||||||||||||||||||||
| Core Net Income | $ | 14,699 | $ | 14,250 | $ | 12,018 | $ | 15,037 | $ | 12,151 | |||||||||||||||||||
| Weighted Average Common Shares - Diluted | 16,482 | 16,373 | 16,441 | 16,493 | 16,844 | ||||||||||||||||||||||||
| Earnings per Share - Diluted | $ | 0.80 | $ | 0.87 | $ | 0.73 | $ | 0.91 | $ | 0.89 | |||||||||||||||||||
| Core Earnings per Share - Diluted | $ | 0.89 | $ | 0.87 | $ | 0.73 | $ | 0.91 | $ | 0.72 | |||||||||||||||||||
| Average Assets | $ | 3,765,041 | $ | 3,761,511 | $ | 3,651,812 | $ | 3,498,540 | $ | 3,378,296 | |||||||||||||||||||
Return on Average Assets(1) | 1.38 | % | 1.52 | % | 1.33 | % | 1.71 | % | 1.77 | % | |||||||||||||||||||
Core Return on Average Assets(1) | 1.55 | % | 1.52 | % | 1.33 | % | 1.71 | % | 1.43 | % | |||||||||||||||||||
| Average Equity | $ | 427,950 | $ | 414,044 | $ | 405,302 | $ | 391,750 | $ | 383,922 | |||||||||||||||||||
Return on Average Equity(1) | 12.16 | % | 13.80 | % | 12.03 | % | 15.23 | % | 15.57 | % | |||||||||||||||||||
Core Return on Average Equity(1) | 13.63 | % | 13.80 | % | 12.03 | % | 15.23 | % | 12.56 | % | |||||||||||||||||||
| Net Interest Income | $ | 53,078 | $ | 50,929 | $ | 49,398 | $ | 50,279 | $ | 52,020 | |||||||||||||||||||
| Noninterest Income | 15,039 | 14,361 | 13,373 | 12,464 | 11,068 | ||||||||||||||||||||||||
| Total Revenue | $ | 68,117 | $ | 65,290 | $ | 62,771 | $ | 62,743 | $ | 63,088 | |||||||||||||||||||
| Noninterest Expense | 45,722 | 43,186 | 43,681 | 39,103 | 38,354 | ||||||||||||||||||||||||
Efficiency Ratio(2) | 67.1 | % | 66.1 | % | 69.6 | % | 62.3 | % | 60.8 | % | |||||||||||||||||||
| Net Interest Income | $ | 53,078 | $ | 50,929 | $ | 49,398 | $ | 50,279 | $ | 52,020 | |||||||||||||||||||
| Deduct: Income from the Call of Brokered Time Deposits | — | — | — | — | 4,618 | ||||||||||||||||||||||||
| Core Net Interest Income (a) | $ | 53,078 | $ | 50,929 | $ | 49,398 | $ | 50,279 | $ | 47,402 | |||||||||||||||||||
| Noninterest Income (b) | 15,039 | 14,361 | 13,373 | 12,464 | 11,068 | ||||||||||||||||||||||||
| Core Revenue (a) + (b) | $ | 68,117 | $ | 65,290 | $ | 62,771 | $ | 62,743 | $ | 58,470 | |||||||||||||||||||
| Noninterest Expense | $ | 45,722 | $ | 43,186 | $ | 43,681 | $ | 39,103 | $ | 38,354 | |||||||||||||||||||
| Less: Merger-Related Expenses | 1,577 | — | — | — | 697 | ||||||||||||||||||||||||
| Core Noninterest Expense | $ | 44,145 | $ | 43,186 | $ | 43,681 | $ | 39,103 | $ | 37,657 | |||||||||||||||||||
Core Efficiency Ratio(2) | 64.8 | % | 66.1 | % | 69.6 | % | 62.3 | % | 64.4 | % | |||||||||||||||||||
_______________
(1)Annualized.
(2)The efficiency ratio is calculated by dividing noninterest expense by total revenue (net interest income plus noninterest income).
26
Appendix
Reconciliation of Non-GAAP Measures
| Core Earnings Metrics | Nine Months Ended | ||||||||||
| (in thousands, except per share data) | September 30, 2026 | September 30, 2025 | |||||||||
| Net Income | $ | 39,390 | $ | 42,133 | |||||||
| Deduct: Income from the Call of Brokered Time Deposits, Net of Tax | — | (3,489) | |||||||||
| Add: Merger-Related Expenses, Net of Tax | 1,577 | 2,609 | |||||||||
| Core Net Income | $ | 40,967 | $ | 41,253 | |||||||
| Weighted Average Common Shares - Diluted | 16,437 | 16,850 | |||||||||
| Earnings per Share - Diluted | $ | 2.40 | $ | 2.50 | |||||||
| Core Earnings per Share - Diluted | $ | 2.49 | $ | 2.45 | |||||||
| Average Assets | $ | 3,726,551 | $ | 3,298,170 | |||||||
Return on Average Assets(1) | 1.41 | % | 1.71 | % | |||||||
Core Return on Average Assets(1) | 1.47 | % | 1.67 | % | |||||||
| Average Equity | $ | 415,848 | $ | 373,020 | |||||||
Return on Average Equity(1) | 12.66 | % | 15.10 | % | |||||||
Core Return on Average Equity(1) | 13.17 | % | 14.79 | % | |||||||
| Net Interest Income | $ | 153,405 | $ | 145,713 | |||||||
| Noninterest Income | 42,773 | 36,723 | |||||||||
| Total Revenue | $ | 196,178 | $ | 182,436 | |||||||
| Noninterest Expense | 132,589 | 115,979 | |||||||||
Efficiency Ratio(2) | 67.6 | % | 63.6 | % | |||||||
| Net Interest Income | $ | 153,405 | $ | 145,713 | |||||||
| Deduct: Income from the Call of Brokered Time Deposits | — | 4,618 | |||||||||
| Core Net Interest Income (a) | $ | 153,405 | $ | 141,095 | |||||||
| Noninterest Income (b) | 42,773 | 36,723 | |||||||||
| Core Revenue (a) + (b) | $ | 196,178 | $ | 177,818 | |||||||
| Noninterest Expense | $ | 132,589 | $ | 115,979 | |||||||
| Less: Merger-Related Expenses | 1,577 | 3,361 | |||||||||
| Core Noninterest Expense | $ | 131,012 | $ | 112,618 | |||||||
Core Efficiency Ratio(2) | 66.8 | % | 63.3 | % | |||||||
_______________
(1)Annualized.
(2)The efficiency ratio is calculated by dividing noninterest expense by total revenue (net interest income plus noninterest income).
27
Appendix
Reconciliation of Non-GAAP Measures
| Core Net Interest Margin | Quarter Ended | ||||||||||||||||||||||||||||
| (in thousands) | September 30, 2026 | June 30, 2026 | March 31, 2026 | December 31, 2025 | September 30, 2025 | ||||||||||||||||||||||||
| Net Interest Income | $ | 53,078 | $ | 50,929 | $ | 49,398 | $ | 50,279 | $ | 52,020 | |||||||||||||||||||
| Less: Credit Card Loan Income | 16,405 | 15,808 | 14,882 | 16,196 | 15,386 | ||||||||||||||||||||||||
| Net Interest Income Excluding Credit Card | 36,673 | 35,121 | 34,516 | 34,083 | 36,634 | ||||||||||||||||||||||||
| Average Interest Earning Assets | 3,625,039 | 3,619,887 | 3,509,115 | 3,360,576 | 3,246,653 | ||||||||||||||||||||||||
| Less: Average Credit Card Loans | 143,858 | 137,052 | 133,712 | 133,858 | 129,100 | ||||||||||||||||||||||||
| Average Core Interest Earning Assets | $ | 3,481,181 | $ | 3,482,835 | $ | 3,375,403 | $ | 3,226,718 | $ | 3,117,553 | |||||||||||||||||||
| Core Net Interest Margin | 4.18% | 4.04% | 4.15% | 4.19% | 4.66% | ||||||||||||||||||||||||
| Core Net Interest Margin | Nine Months Ended | ||||||||||
| (in thousands) | September 30, 2026 | September 30, 2025 | |||||||||
| Net Interest Income | $ | 153,405 | $ | 145,713 | |||||||
| Less: Credit Card Loan Income | 47,095 | 43,651 | |||||||||
| Core Net Interest Income | 106,310 | 102,062 | |||||||||
| Average Interest Earning Assets | 3,585,117 | 3,166,588 | |||||||||
| Less: Average Credit Card Loans | 138,244 | 123,117 | |||||||||
| Average Core Interest Earning Assets | $ | 3,446,873 | $ | 3,043,471 | |||||||
| Core Net Interest Margin | 4.12% | 4.48% | |||||||||
| Core Loan Yield | Quarter Ended | ||||||||||||||||||||||||||||
| (in thousands) | September 30, 2026 | June 30, 2026 | March 31, 2026 | December 31, 2025 | September 30, 2025 | ||||||||||||||||||||||||
| Portfolio Loans Receivable Interest Income | $ | 67,942 | $ | 65,110 | $ | 64,009 | $ | 64,670 | $ | 60,610 | |||||||||||||||||||
| Less: Credit Card Loan Income | 16,405 | 15,808 | 14,882 | 16,196 | 15,386 | ||||||||||||||||||||||||
| Core Portfolio Loans Receivable Interest Income | $ | 51,537 | $ | 49,302 | $ | 49,127 | $ | 48,474 | $ | 45,224 | |||||||||||||||||||
| Average Portfolio Loans Receivable | 3,135,648 | 3,058,476 | 3,008,187 | 2,902,033 | 2,789,815 | ||||||||||||||||||||||||
| Less: Average Credit Card Loans | 143,858 | 137,052 | 133,712 | 133,858 | 129,100 | ||||||||||||||||||||||||
| Total Core Average Portfolio Loans Receivable | $ | 2,991,790 | $ | 2,921,424 | $ | 2,874,475 | $ | 2,768,175 | $ | 2,660,715 | |||||||||||||||||||
| Core Portfolio Loans Receivable Yield | 6.83% | 6.77% | 6.93% | 6.95% | 6.74% | ||||||||||||||||||||||||
| Core Loan Yield | Nine Months Ended | ||||||||||
| (in thousands) | September 30, 2026 | September 30, 2025 | |||||||||
| Portfolio Loans Receivable Interest Income | $ | 197,062 | $ | 179,710 | |||||||
| Less: Credit Card Loan Income | 47,095 | 43,651 | |||||||||
| Core Portfolio Loans Receivable Interest Income | $ | 149,967 | $ | 136,059 | |||||||
| Average Portfolio Loans Receivable | 3,067,904 | 2,719,834 | |||||||||
| Less: Average Credit Card Loans | 138,244 | 123,117 | |||||||||
| Total Core Average Portfolio Loans Receivable | $ | 2,929,660 | $ | 2,596,717 | |||||||
| Core Portfolio Loans Receivable Yield | 6.84% | 7.01% | |||||||||
28
Appendix
Reconciliation of Non-GAAP Measures
| Pre-tax, Pre-Provision Net Revenue ("PPNR") | Quarter Ended | ||||||||||||||||||||||||||||
| (in thousands) | September 30, 2026 | June 30, 2026 | March 31, 2026 | December 31, 2025 | September 30, 2025 | ||||||||||||||||||||||||
Net Income | $ | 13,122 | $ | 14,250 | $ | 12,018 | $ | 15,037 | $ | 15,065 | |||||||||||||||||||
| Add: Income Tax Expense | 4,424 | 4,204 | 3,853 | 4,644 | 4,802 | ||||||||||||||||||||||||
| Add: Provision for Credit Losses | 4,903 | 3,585 | 3,014 | 3,988 | 4,650 | ||||||||||||||||||||||||
| Add: Provision for (Release of) Credit Losses on Unfunded Commitments | (54) | 65 | 205 | (29) | 217 | ||||||||||||||||||||||||
| Pre-tax, Pre-Provision Net Revenue ("PPNR") | $ | 22,395 | $ | 22,104 | $ | 19,090 | $ | 23,640 | $ | 24,734 | |||||||||||||||||||
| Pre-tax, Pre-Provision Net Revenue ("PPNR") | Nine Months Ended | ||||||||||
| (in thousands) | September 30, 2026 | September 30, 2025 | |||||||||
Net Income | $ | 39,390 | $ | 42,133 | |||||||
| Add: Income Tax Expense | 12,481 | 13,130 | |||||||||
| Add: Provision for Credit Losses | 11,502 | 10,977 | |||||||||
| Add: Provision for Credit Losses on Unfunded Commitments | 216 | 217 | |||||||||
| Pre-tax, Pre-Provision Net Revenue ("PPNR") | $ | 63,589 | $ | 66,457 | |||||||
| Core PPNR | Quarter Ended | ||||||||||||||||||||||||||||
| (in thousands) | September 30, 2026 | June 30, 2026 | March 31, 2026 | December 31, 2025 | September 30, 2025 | ||||||||||||||||||||||||
Net Income | $ | 13,122 | $ | 14,250 | $ | 12,018 | $ | 15,037 | $ | 15,065 | |||||||||||||||||||
| Add: Income Tax Expense | 4,424 | 4,204 | 3,853 | 4,644 | 4,802 | ||||||||||||||||||||||||
| Add: Provision for Credit Losses | 4,903 | 3,585 | 3,014 | 3,988 | 4,650 | ||||||||||||||||||||||||
| Add: Provision for (Release of) Credit Losses on Unfunded Commitments | (54) | 65 | 205 | (29) | 217 | ||||||||||||||||||||||||
| Deduct: Income from the Call of Brokered Time Deposits | — | — | — | — | (4,618) | ||||||||||||||||||||||||
| Add: Merger-Related Expenses | 1,577 | — | — | — | 697 | ||||||||||||||||||||||||
| Core PPNR | $ | 23,972 | $ | 22,104 | $ | 19,090 | $ | 23,640 | $ | 20,813 | |||||||||||||||||||
| Core PPNR | Nine Months Ended | ||||||||||
| (in thousands) | September 30, 2026 | September 30, 2025 | |||||||||
Net Income | $ | 39,390 | $ | 42,133 | |||||||
| Add: Income Tax Expense | 12,481 | 13,130 | |||||||||
| Add: Provision for Credit Losses | 11,502 | 10,977 | |||||||||
| Add: Provision for Credit Losses on Unfunded Commitments | 216 | 217 | |||||||||
| Deduct: Income from the Call of Brokered Time Deposits | — | (4,618) | |||||||||
| Add: Merger-Related Expenses | 1,577 | 3,361 | |||||||||
| Core PPNR | $ | 65,166 | $ | 65,200 | |||||||
29
Appendix
Reconciliation of Non-GAAP Measures
| Allowance for Credit Losses to Total Portfolio Loans | Quarter Ended | ||||||||||||||||||||||||||||
| (in thousands) | September 30, 2026 | June 30, 2026 | March 31, 2026 | December 31, 2025 | September 30, 2025 | ||||||||||||||||||||||||
| Allowance for Credit Losses | $ | 55,493 | $ | 54,431 | $ | 54,680 | $ | 54,660 | $ | 53,045 | |||||||||||||||||||
| Total Portfolio Loans | 3,114,264 | 3,085,950 | 3,026,431 | 2,959,457 | 2,821,983 | ||||||||||||||||||||||||
| Allowance for Credit Losses to Total Portfolio Loans | 1.78% | 1.76% | 1.81% | 1.85% | 1.88% | ||||||||||||||||||||||||
| Commercial Bank Allowance for Credit Losses to Commercial Bank Portfolio Loans | Quarter Ended | ||||||||||||||||||||||||||||
| (in thousands) | September 30, 2026 | June 30, 2026 | March 31, 2026 | December 31, 2025 | September 30, 2025 | ||||||||||||||||||||||||
| Allowance for Credit Losses | $ | 55,493 | $ | 54,431 | $ | 54,680 | $ | 54,660 | $ | 53,045 | |||||||||||||||||||
| Less: Credit Card Allowance for Credit Losses | 9,777 | 8,904 | 7,802 | 8,232 | 7,413 | ||||||||||||||||||||||||
| Commercial Bank Allowance for Credit Losses | $ | 45,716 | $ | 45,527 | $ | 46,878 | $ | 46,428 | $ | 45,632 | |||||||||||||||||||
| Total Portfolio Loans | 3,114,264 | 3,085,950 | 3,026,431 | 2,959,457 | 2,821,983 | ||||||||||||||||||||||||
| Less: Gross Credit Card Loans | 144,258 | 141,446 | 131,887 | 137,905 | 130,897 | ||||||||||||||||||||||||
| Commercial Bank Portfolio Loans | $ | 2,970,006 | $ | 2,944,504 | $ | 2,894,544 | $ | 2,821,552 | $ | 2,691,086 | |||||||||||||||||||
| Commercial Bank Allowance for Credit Losses to Commercial Bank Portfolio Loans | 1.54% | 1.55% | 1.62% | 1.65% | 1.70% | ||||||||||||||||||||||||
| Nonperforming Assets to Total Assets | Quarter Ended | ||||||||||||||||||||||||||||
| (in thousands) | September 30, 2026 | June 30, 2026 | March 31, 2026 | December 31, 2025 | September 30, 2025 | ||||||||||||||||||||||||
| Total Nonperforming Assets | $ | 60,518 | $ | 60,843 | $ | 59,273 | $ | 58,276 | $ | 52,247 | |||||||||||||||||||
| Total Assets | 3,802,553 | 3,889,938 | 3,808,467 | 3,606,207 | 3,389,442 | ||||||||||||||||||||||||
| Nonperforming Assets to Total Assets | 1.59% | 1.56% | 1.56% | 1.62% | 1.54% | ||||||||||||||||||||||||
| Nonperforming Loans to Total Portfolio Loans | Quarter Ended | ||||||||||||||||||||||||||||
| (in thousands) | September 30, 2026 | June 30, 2026 | March 31, 2026 | December 31, 2025 | September 30, 2025 | ||||||||||||||||||||||||
| Total Nonperforming Loans | $ | 56,662 | $ | 56,987 | $ | 55,417 | $ | 54,421 | $ | 52,247 | |||||||||||||||||||
| Total Portfolio Loans | 3,114,264 | 3,085,950 | 3,026,431 | 2,959,457 | 2,821,983 | ||||||||||||||||||||||||
| Nonperforming Loans to Total Portfolio Loans | 1.82% | 1.85% | 1.83% | 1.84% | 1.85% | ||||||||||||||||||||||||
30
Appendix
Reconciliation of Non-GAAP Measures
| Net Charge-Offs to Average Portfolio Loans | Quarter Ended | ||||||||||||||||||||||||||||
| (in thousands) | September 30, 2026 | June 30, 2026 | March 31, 2026 | December 31, 2025 | September 30, 2025 | ||||||||||||||||||||||||
| Total Net Charge-Offs | $ | 3,841 | $ | 3,834 | $ | 2,994 | $ | 2,373 | $ | 2,476 | |||||||||||||||||||
| Total Average Portfolio Loans | 3,135,648 | 3,058,476 | 3,008,187 | 2,902,033 | 2,789,815 | ||||||||||||||||||||||||
| Net Charge-Offs to Average Portfolio Loans, Annualized | 0.49% | 0.50% | 0.40% | 0.32% | 0.35% | ||||||||||||||||||||||||
| Net Charge-offs to Average Portfolio Loans | Nine Months Ended | ||||||||||
| (in thousands) | September 30, 2026 | September 30, 2025 | |||||||||
| Total Net Charge-Offs | $ | 10,669 | $ | 10,008 | |||||||
| Total Average Portfolio Loans | 3,067,904 | 2,719,834 | |||||||||
| Net Charge-Offs to Average Portfolio Loans, Annualized | 0.46% | 0.49% | |||||||||
| Tangible Book Value per Share | Quarter Ended | ||||||||||||||||||||||||||||
| (in thousands, except share and per share data) | September 30, 2026 | June 30, 2026 | March 31, 2026 | December 31, 2025 | September 30, 2025 | ||||||||||||||||||||||||
| Total Stockholders' Equity | $ | 431,450 | $ | 422,205 | $ | 408,859 | $ | 401,757 | $ | 394,770 | |||||||||||||||||||
Less: Intangible Assets | 39,958 | 40,219 | 40,480 | 40,740 | 41,002 | ||||||||||||||||||||||||
| Tangible Common Equity | $ | 391,492 | $ | 381,986 | $ | 368,379 | $ | 361,017 | $ | 353,768 | |||||||||||||||||||
| Period End Shares Outstanding | 16,328,648 | 16,289,288 | 16,286,480 | 16,373,288 | 16,589,241 | ||||||||||||||||||||||||
| Tangible Book Value per Share | $ | 23.98 | $ | 23.45 | $ | 22.62 | $ | 22.05 | $ | 21.33 | |||||||||||||||||||
| Return on Average Tangible Common Equity | Quarter Ended | ||||||||||||||||||||||||||||
| (in thousands) | September 30, 2026 | June 30, 2026 | March 31, 2026 | December 31, 2025 | September 30, 2025 | ||||||||||||||||||||||||
Net Income | $ | 13,122 | $ | 14,250 | $ | 12,018 | $ | 15,037 | $ | 15,065 | |||||||||||||||||||
| Add: Intangible Amortization, Net of Tax | 195 | 201 | 197 | 200 | 199 | ||||||||||||||||||||||||
| Net Tangible Income | $ | 13,317 | $ | 14,451 | $ | 12,215 | $ | 15,237 | $ | 15,264 | |||||||||||||||||||
| Average Equity | 427,950 | 414,044 | 405,302 | 391,750 | 383,922 | ||||||||||||||||||||||||
| Less: Average Intangible Assets | 40,116 | 40,377 | 40,628 | 40,884 | 37,706 | ||||||||||||||||||||||||
| Net Average Tangible Common Equity | $ | 387,834 | $ | 373,667 | $ | 364,674 | $ | 350,866 | $ | 346,216 | |||||||||||||||||||
| Return on Average Equity | 12.16 | % | 13.80 | % | 12.03 | % | 15.23 | % | 15.57 | % | |||||||||||||||||||
| Return on Average Tangible Common Equity | 13.62 | % | 15.51 | % | 13.58 | % | 17.23 | % | 17.49 | % | |||||||||||||||||||
| Return on Average Tangible Common Equity | Nine Months Ended | ||||||||||
| (in thousands) | September 30, 2026 | September 30, 2025 | |||||||||
Net Income | $ | 39,390 | $ | 42,133 | |||||||
| Add: Intangible Amortization, Net of Tax | 594 | 599 | |||||||||
| Net Tangible Income | $ | 39,984 | $ | 42,732 | |||||||
| Average Equity | 415,848 | 373,020 | |||||||||
| Less: Average Intangible Assets | 40,372 | 38,048 | |||||||||
| Net Average Tangible Common Equity | $ | 375,476 | $ | 334,972 | |||||||
| Return on Average Equity | 12.66 | % | 15.10 | % | |||||||
| Return on Average Tangible Common Equity | 14.24 | % | 17.06 | % | |||||||
31
Appendix
Reconciliation of Non-GAAP Measures
| Core Return on Average Tangible Common Equity | Quarter Ended | ||||||||||||||||||||||||||||
| (in thousands) | September 30, 2026 | June 30, 2026 | March 31, 2026 | December 31, 2025 | September 30, 2025 | ||||||||||||||||||||||||
| Core Net Income | $ | 14,699 | $ | 14,250 | $ | 12,018 | $ | 15,037 | $ | 12,151 | |||||||||||||||||||
| Add: Intangible Amortization, Net of Tax | 195 | 201 | 197 | 200 | 199 | ||||||||||||||||||||||||
| Core Net Tangible Income | $ | 14,894 | $ | 14,451 | $ | 12,215 | $ | 15,237 | $ | 12,350 | |||||||||||||||||||
| Core Return on Average Tangible Common Equity | 15.24 | % | 15.51 | % | 13.58 | % | 17.23 | % | 14.15 | % | |||||||||||||||||||
| Core Return on Average Tangible Common Equity | Nine Months Ended | ||||||||||
| (in thousands) | September 30, 2026 | September 30, 2025 | |||||||||
| Core Net Income | $ | 40,967 | $ | 41,253 | |||||||
| Add: Intangible Amortization, Net of Tax | 594 | 599 | |||||||||
| Core Net Tangible Income | $ | 41,561 | $ | 41,852 | |||||||
| Core Return on Average Tangible Common Equity | 14.80 | % | 16.70 | % | |||||||
32
ABOUT CAPITAL BANCORP, INC.
Capital Bancorp, Inc., Rockville, Maryland is a registered bank holding company incorporated under the laws of Maryland. Capital Bancorp has been providing financial services since 1999 and now operates bank branches in four locations in the Washington, D.C., and Baltimore, Maryland metropolitan markets, one bank branch in Fort Lauderdale, Florida, one bank branch in Chicago, Illinois and one bank branch in Raleigh, North Carolina. Capital Bancorp had assets of approximately $3.8 billion at September 30, 2026 and its common stock is traded in the NASDAQ Global Market under the symbol “CBNK.” More information can be found at the Company's website www.CapitalBankMD.com under its investor relations page.
FORWARD-LOOKING STATEMENTS
This earnings release contains forward-looking statements. These forward-looking statements reflect our current views with respect to, among other things, future events and our financial performance. Any statements about our management’s expectations, beliefs, plans, predictions, forecasts, objectives, assumptions or future events or performance are not historical facts and may be forward-looking. These statements are often, but not always, made through the use of words or phrases such as “anticipate,” “believes,” “can,” “could,” “may,” “predicts,” “potential,” “should,” “will,” “estimate,” “plans,” “projects,” “continuing,” “ongoing,” “expects,” "optimistic," “intends” and similar words or phrases. Any or all of the forward-looking statements in this earnings release may turn out to be inaccurate. The inclusion of forward-looking information in this earnings release should not be regarded as a representation by us or any other person that the future plans, estimates or expectations contemplated by us will be achieved. We have based these forward-looking statements largely on our current expectations and projections about future events and financial trends that we believe may affect our financial condition, results of operations, business strategy and financial needs. Our actual results could differ materially from those anticipated in such forward-looking statements. Accordingly, we caution you that any such forward-looking statements are not a guarantee of future performance and that actual results may prove to be materially different from the results expressed or implied by the forward-looking statements due to a number of factors. For details on some of the factors that could affect these expectations, see risk factors and other cautionary language included in the Company's Annual Report on Form 10-K and other periodic and current reports filed with the Securities and Exchange Commission.
While there is no assurance that any list of risks and uncertainties or risk factors is complete, below are certain factors that could cause actual results to differ materially from those contained or implied in the forward-looking statements: the strength of the United States (“U.S.”) economy in general and the strength of the local economies in
which we conduct operations; geopolitical concerns, including acts or threats of terrorism and the ongoing wars in Iran and Ukraine; uncertainty in U.S. fiscal and monetary policy, including the interest rate policies of the Board of Governors of the Federal Reserve System; inflation, interest rate, market, and monetary fluctuations; volatility and disruptions in global capital and credit markets; changes in U.S. trade policies, including the implementation of tariffs and other protectionist trade policies; the effects of federal government shutdowns, debt ceiling standoff, or other fiscal policy uncertainty; competitive pressures on product pricing and services; success, impact, and timing of our business strategies, including market acceptance of any new products or services; the impact of changes in financial services policies, laws, and regulations, including those concerning taxes, banking, securities, and insurance, and the application thereof by regulatory bodies; cybersecurity threats and the cost of defending against them; climate change, and other catastrophic disasters; the effectiveness of the Company's internal control over financial reporting and disclosure controls and procedures; the Company’s ability to remediate the material weakness in the Company’s internal control over financial reporting; the effect of the IFH acquisition or any other acquisitions we have made or may make, including, without limitation, the failure to achieve the expected revenue growth and/or expense savings from such acquisitions, and/or the failure to effectively integrate an acquisition target into our operations, including the planned growth of Windsor AdvantageTM; the possibility that the Company's pending merger with Peoples does not close when expected or at all because required regulatory approvals and other conditions to closing are not received or satisfied on a timely basis or at all; the possibility that the anticipated benefits and cost savings from the merger with Peoples may not be fully realized or may take longer to realize than expected; disruptions to the Company's business as a result of the announcement and pendency of the merger with Peoples; the possibility that the merger with Peoples may be more expensive to complete than anticipated, including as a result of unexpected factors or events; and our ability to manage the risks involved in the foregoing.
These forward-looking statements are made as of the date of this communication, and the Company does not intend, and assumes no obligation, to update any forward-looking statement to reflect events or circumstances after the date on which the statement is made or to reflect the occurrence of unanticipated events or circumstances, except as required by law.
FINANCIAL CONTACT: Jake Dalaya (301) 637-5118
MEDIA CONTACT: Ed Barry (240) 283-1912
WEB SITE: www.CapitalBankMD.com
33

3Q 2026 Investor Overview
Forward Looking Statements This presentation contains forward-looking statements. These forward-looking statements reflect our current views with respect to, among other things, future events and our financial performance. Any statements about our management’s expectations, beliefs, plans, predictions, forecasts, objectives, assumptions or future events or performance are not historical facts and may be forward- looking. These statements are often, but not always, made through the use of words or phrases such as “anticipate,” “believes,” “can,” “could,” “may,” “predicts,” “potential,” “should,” “will,” “estimate,” “plans,” “projects,” “continuing,” “ongoing,” “expects,” "optimistic," “intends” and similar words or phrases. Any or all of the forward-looking statements in this presentation may turn out to be inaccurate. The inclusion of forward-looking information in this presentation should not be regarded as a representation by us or any other person that the future plans, estimates or expectations contemplated by us will be achieved. We have based these forward-looking statements largely on our current expectations and projections about future events and financial trends that we believe may affect our financial condition, results of operations, business strategy and financial needs. Our actual results could differ materially from those anticipated in such forward-looking statements. Accordingly, we caution you that any such forward-looking statements are not a guarantee of future performance and that actual results may prove to be materially different from the results expressed or implied by the forward-looking statements due to a number of factors. For details on some of the factors that could affect these expectations, see risk factors and other cautionary language included in the Company's Annual Report on Form 10-K and other periodic and current reports filed with the Securities and Exchange Commission. While there is no assurance that any list of risks and uncertainties or risk factors is complete, below are certain factors which could cause actual results to differ materially from those contained or implied in the forward-looking statements: the strength of the United States (“U.S.”) economy in general and the strength of the local economies in which we conduct operations; geopolitical concerns, including acts or threats of terrorism and the ongoing wars in Iran and Ukraine; uncertainty in U.S. fiscal and monetary policy, including the interest rate policies of the Board of Governors of the Federal Reserve System; inflation, interest rate, market, and monetary fluctuations; volatility and disruptions in global capital and credit markets; changes in U.S. trade policies, including the implementation of tariffs and other protectionist trade policies; the effects of federal government shutdowns, debt ceiling standoff, or other fiscal policy uncertainty; competitive pressures on product pricing and services; success, impact, and timing of our business strategies, including market acceptance of any new products or services; the impact of changes in financial services policies, laws, and regulations, including those concerning taxes, banking, securities, and insurance, and the application thereof by regulatory bodies; cybersecurity threats and the cost of defending against them; climate change, and other catastrophic disasters; the effectiveness of the Company's internal control over financial reporting and disclosure controls and procedures; the Company’s ability to remediate the material weakness in the Company’s internal control over financial reporting; the effect of the IFH acquisition or any other acquisitions we have made or may make, including, without limitation, the failure to achieve the expected revenue growth and/or expense savings from such acquisitions, and/or the failure to effectively integrate an acquisition target into our operations, including the planned growth of Windsor AdvantageTM; the possibility that the Company’s pending merger with Peoples does not close when expected or at all because required regulatory or other approvals and other conditions to closing are not received or satisfied on a timely basis or at all; the possibility that the anticipated benefits and cost savings from the merger with Peoples may not be fully realized or may take longer to realize than expected; disruptions to the Company’s business as a result of the announcement and pendency of the merger with Peoples; the possibility that the merger with Peoples may be more expensive to complete than anticipated, including as a result of unexpected factors or events; and our ability to manage the risks involved in the foregoing. Except as otherwise indicated, this presentation speaks as of the date hereof. The delivery of this presentation shall not, under any circumstances, create any implication that there has been no change in the affairs of the Company after the date hereof. Certain of the information contained herein may be derived from information provided by industry sources. The Company believes that such information is accurate and that the sources from which it has been obtained are reliable. The Company cannot guarantee the accuracy of such information, however, and has not independently verified such information. While the Company is not aware of any misstatements regarding the industry data presented in this presentation, the Company’s estimates involve risks and uncertainties and are subject to change based on various factors. Similarly, the Company believes that its internal research is reliable, even though such research has not been verified by independent sources. Non-U.S. GAAP Financial Measures This presentation may include certain non–U.S. generally accepted accounting principles ("GAAP") financial measures intended to supplement, not substitute for, comparable GAAP measures. These non-GAAP financial measures should not be considered in isolation, and should be considered as additions to, and not substitutes for or superior to, measures of financial performance prepared in accordance with GAAP. There are a number of limitations related to the use of these non-GAAP financial measures versus their nearest GAAP equivalents. For example, other companies may calculate non-GAAP financial measures differently or may use other measures to evaluate their performance, all of which could reduce the usefulness of the Company's non-GAAP financial measures as tools for comparison. If included in this presentation, see the Appendix to this presentation for a reconciliation of the non-GAAP financial measures used in (or conveyed orally during) this presentation to their most directly comparable GAAP financial measures. Core Financial Measures As used in this presentation, Core net income, Core fee revenue, Core ROA, Core ROE, ROTCE, Core ROTCE, Core NIM, Core Loan Yield, Core efficiency ratio, Commercial Bank ACL Coverage Ratio, and Tangible Book Value are non-GAAP financial measures. These non-GAAP financial metrics exclude the impact of income from the call of brokered time deposits, merger-related expenses and certain other pre-tax adjustments which are not indicative of operating performance and tax impacts of such adjustments. Reconciliations of these and other non-GAAP measures to their comparable GAAP measures are set forth in the Appendix to this presentation. 2
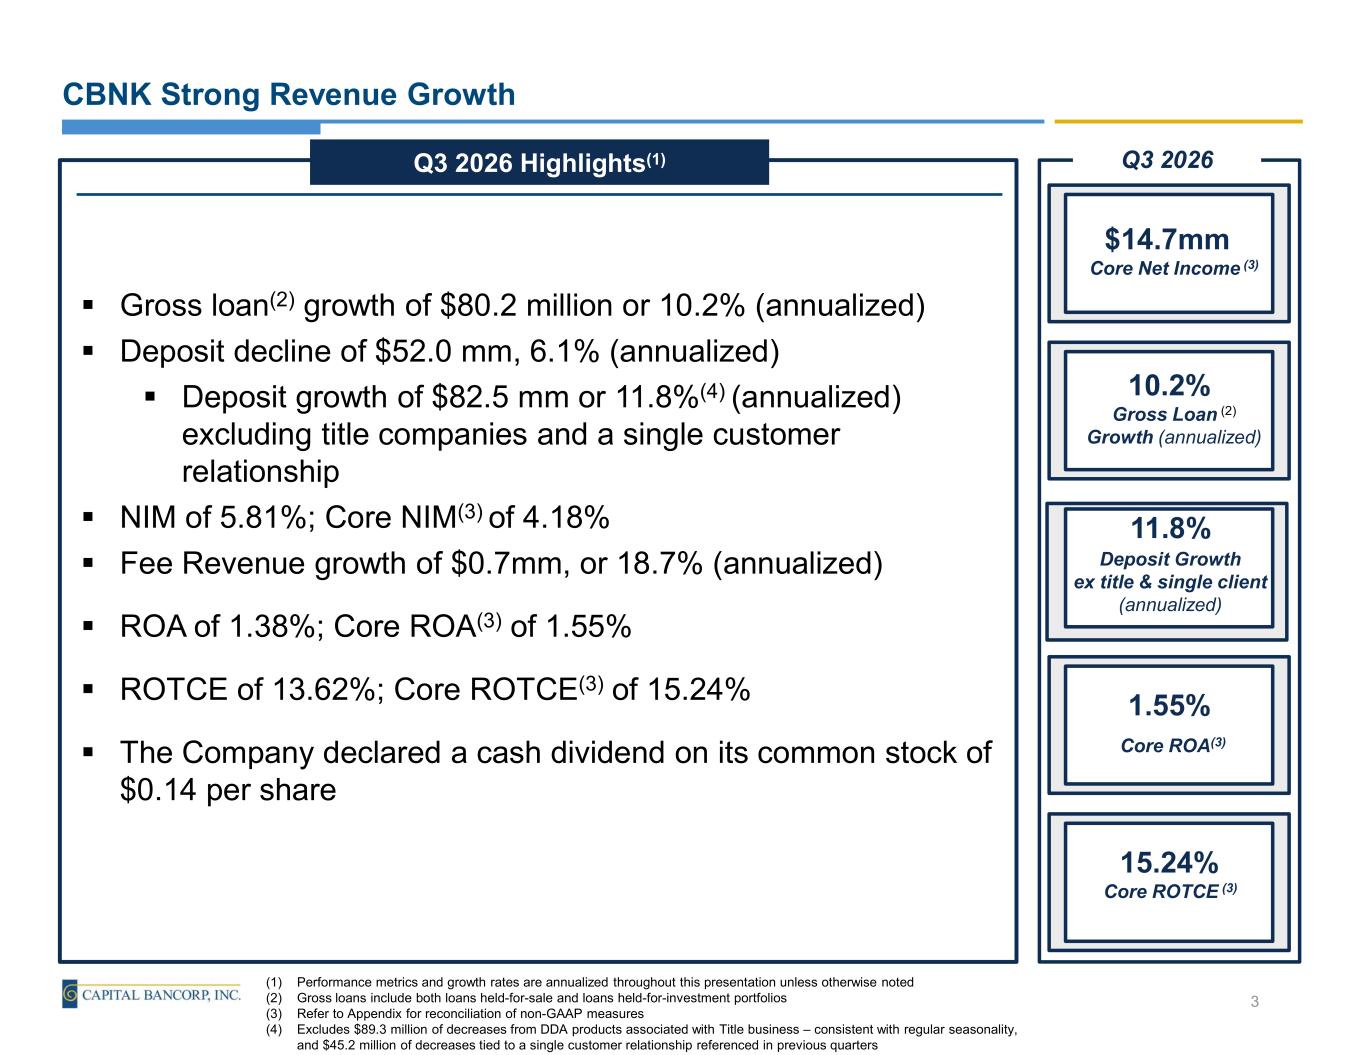
CBNK Strong Revenue Growth (1) Performance metrics and growth rates are annualized throughout this presentation unless otherwise noted (2) Gross loans include both loans held-for-sale and loans held-for-investment portfolios (3) Refer to Appendix for reconciliation of non-GAAP measures (4) Excludes $89.3 million of decreases from DDA products associated with Title business – consistent with regular seasonality, and $45.2 million of decreases tied to a single customer relationship referenced in previous quarters Gross loan(2) growth of $80.2 million or 10.2% (annualized) Deposit decline of $52.0 mm, 6.1% (annualized) Deposit growth of $82.5 mm or 11.8%(4) (annualized) excluding title companies and a single customer relationship NIM of 5.81%; Core NIM(3) of 4.18% Fee Revenue growth of $0.7mm, or 18.7% (annualized) ROA of 1.38%; Core ROA(3) of 1.55% ROTCE of 13.62%; Core ROTCE(3) of 15.24% The Company declared a cash dividend on its common stock of $0.14 per share Q3 2026 Highlights(1) Core Net Income (3) $14.7mm Gross Loan (2) Growth (annualized) 10.2% Deposit Growth ex title & single client (annualized) 11.8% Core ROA(3) 1.55% Core ROTCE (3) 15.24% Q3 2026 3
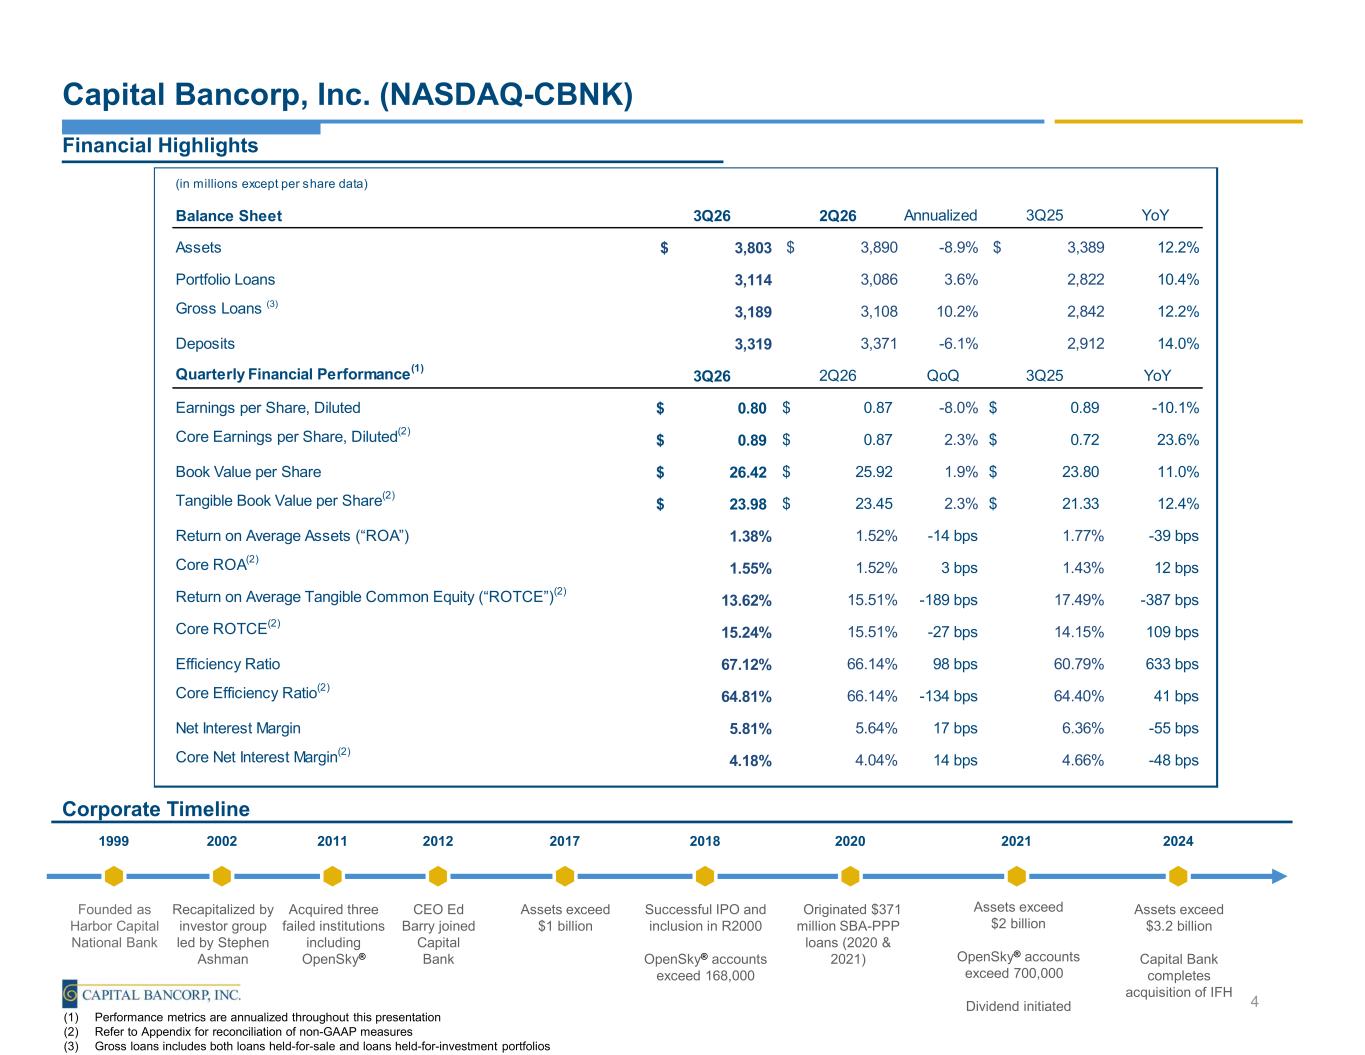
Capital Bancorp, Inc. (NASDAQ-CBNK) Financial Highlights Corporate Timeline Founded as Harbor Capital National Bank Recapitalized by investor group led by Stephen Ashman Acquired three failed institutions including OpenSky® CEO Ed Barry joined Capital Bank Assets exceed $1 billion Successful IPO and inclusion in R2000 OpenSky® accounts exceed 168,000 1999 2002 2011 2012 2017 2018 Originated $371 million SBA-PPP loans (2020 & 2021) 2020 Assets exceed $2 billion OpenSky® accounts exceed 700,000 Dividend initiated 2021 (1) Performance metrics are annualized throughout this presentation (2) Refer to Appendix for reconciliation of non-GAAP measures (3) Gross loans includes both loans held-for-sale and loans held-for-investment portfolios Assets exceed $3.2 billion Capital Bank completes acquisition of IFH 2024 4 (in millions except per share data) Balance Sheet 3Q26 2Q26 Annualized 3Q25 YoY Assets $ 3,803 $ 3,890 -8.9% $ 3,389 12.2% Portfolio Loans 3,114 3,086 3.6% 2,822 10.4% Gross Loans (3) 3,189 3,108 10.2% 2,842 12.2% Deposits 3,319 3,371 -6.1% 2,912 14.0% Quarterly Financial Performance(1) 3Q26 2Q26 QoQ 3Q25 YoY Earnings per Share, Diluted 0.80$ 0.87$ -8.0% 0.89$ -10.1% Core Earnings per Share, Diluted(2) 0.89$ 0.87$ 2.3% 0.72$ 23.6% Book Value per Share 26.42$ 25.92$ 1.9% 23.80$ 11.0% Tangible Book Value per Share(2) 23.98$ 23.45$ 2.3% 21.33$ 12.4% Return on Average Assets (“ROA”) 1.38% 1.52% -14 bps 1.77% -39 bps Core ROA(2) 1.55% 1.52% 3 bps 1.43% 12 bps Return on Average Tangible Common Equity (“ROTCE”)(2) 13.62% 15.51% -189 bps 17.49% -387 bps Core ROTCE(2) 15.24% 15.51% -27 bps 14.15% 109 bps Efficiency Ratio 67.12% 66.14% 98 bps 60.79% 633 bps Core Efficiency Ratio(2) 64.81% 66.14% -134 bps 64.40% 41 bps Net Interest Margin 5.81% 5.64% 17 bps 6.36% -55 bps Core Net Interest Margin(2) 4.18% 4.04% 14 bps 4.66% -48 bps
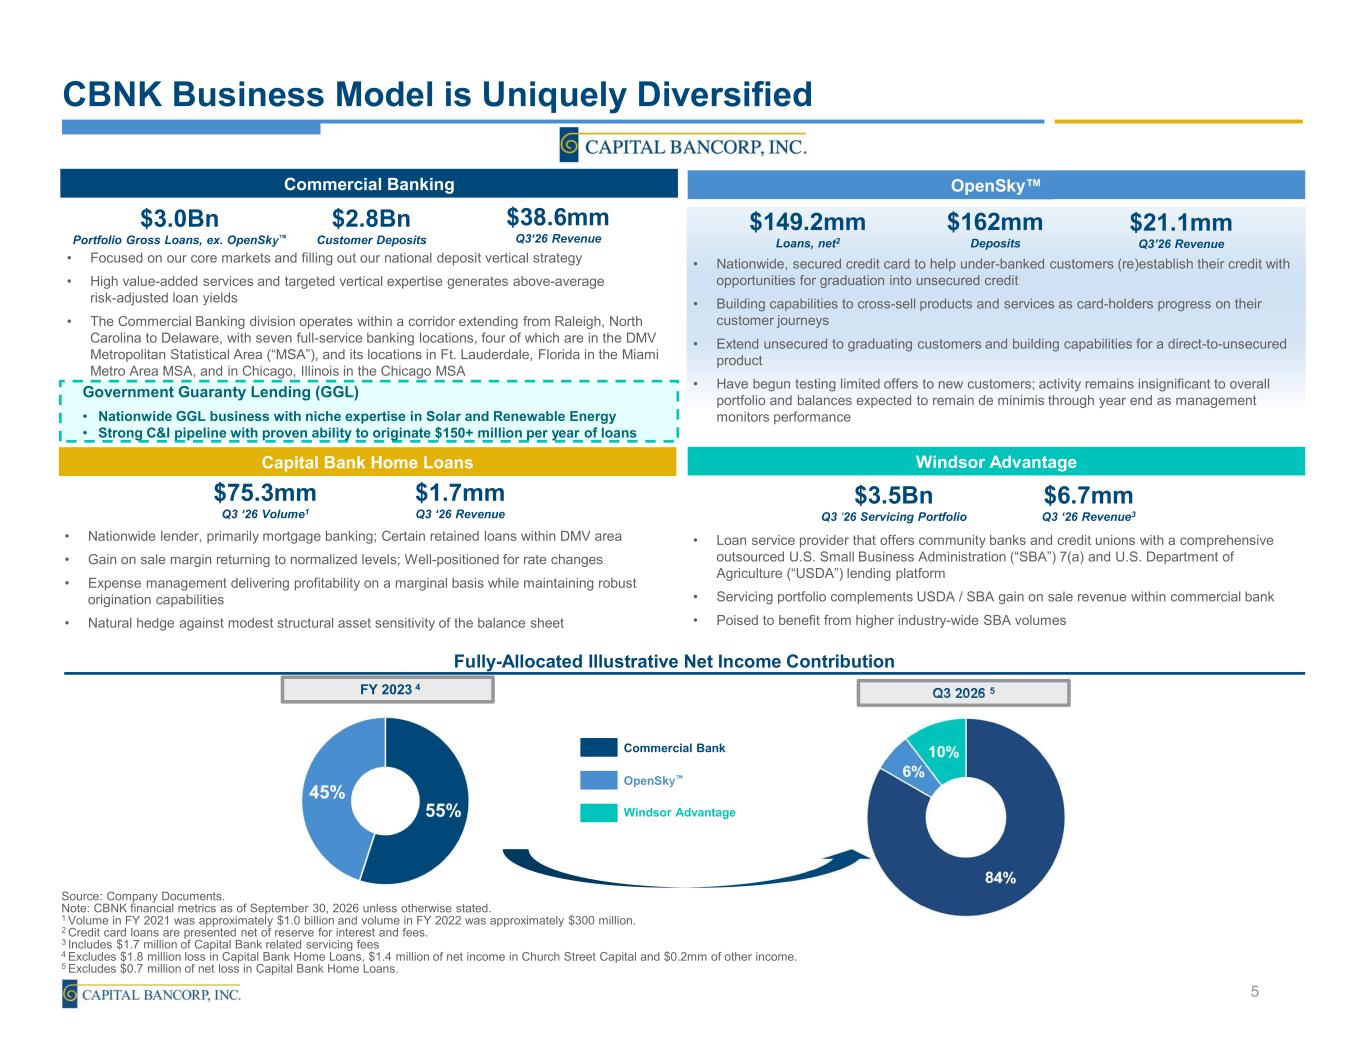
$3.5Bn Q3 ‘26 Servicing Portfolio $6.7mm Q3 ‘26 Revenue3 • Loan service provider that offers community banks and credit unions with a comprehensive outsourced U.S. Small Business Administration (“SBA”) 7(a) and U.S. Department of Agriculture (“USDA”) lending platform • Servicing portfolio complements USDA / SBA gain on sale revenue within commercial bank • Poised to benefit from higher industry-wide SBA volumes CBNK Business Model is Uniquely Diversified Source: Company Documents. Note: CBNK financial metrics as of September 30, 2026 unless otherwise stated. 1 Volume in FY 2021 was approximately $1.0 billion and volume in FY 2022 was approximately $300 million. 2 Credit card loans are presented net of reserve for interest and fees. 3 Includes $1.7 million of Capital Bank related servicing fees 4 Excludes $1.8 million loss in Capital Bank Home Loans, $1.4 million of net income in Church Street Capital and $0.2mm of other income. 5 Excludes $0.7 million of net loss in Capital Bank Home Loans. Commercial Bank OpenSky Windsor Advantage Commercial Banking Government Guaranty Lending (GGL) • Nationwide GGL business with niche expertise in Solar and Renewable Energy • Strong C&I pipeline with proven ability to originate $150+ million per year of loans $3.0Bn Portfolio Gross Loans, ex. OpenSky $2.8Bn Customer Deposits • Focused on our core markets and filling out our national deposit vertical strategy • High value-added services and targeted vertical expertise generates above-average risk-adjusted loan yields • The Commercial Banking division operates within a corridor extending from Raleigh, North Carolina to Delaware, with seven full-service banking locations, four of which are in the DMV Metropolitan Statistical Area (“MSA”), and its locations in Ft. Lauderdale, Florida in the Miami Metro Area MSA, and in Chicago, Illinois in the Chicago MSA $38.6mm Q3‘26 Revenue Fully-Allocated Illustrative Net Income Contribution 5 $75.3mm Q3 ‘26 Volume1 $1.7mm Q3 ‘26 Revenue • Nationwide lender, primarily mortgage banking; Certain retained loans within DMV area • Gain on sale margin returning to normalized levels; Well-positioned for rate changes • Expense management delivering profitability on a marginal basis while maintaining robust origination capabilities • Natural hedge against modest structural asset sensitivity of the balance sheet $162mm Deposits $149.2mm Loans, net2 • Nationwide, secured credit card to help under-banked customers (re)establish their credit with opportunities for graduation into unsecured credit • Building capabilities to cross-sell products and services as card-holders progress on their customer journeys • Extend unsecured to graduating customers and building capabilities for a direct-to-unsecured product • Have begun testing limited offers to new customers; activity remains insignificant to overall portfolio and balances expected to remain de minimis through year end as management monitors performance $21.1mm Q3’26 Revenue Capital Bank Home Loans OpenSky Windsor Advantage FY 2023 4 Q3 2026 5

Financial Information
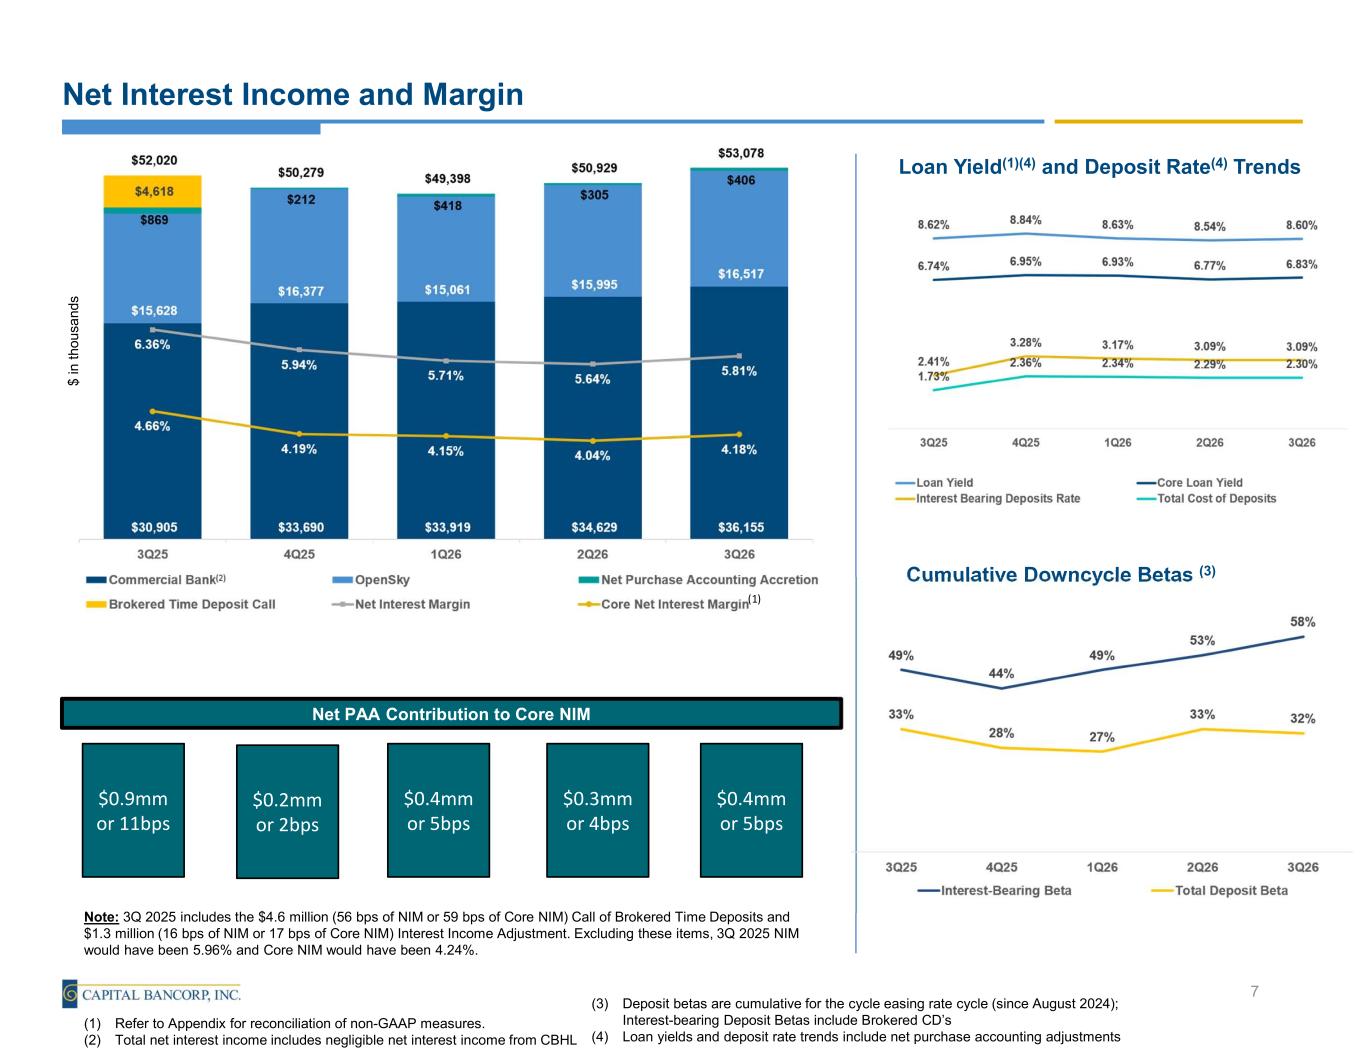
Net Interest Income and Margin $ in t ho u sa nd s 7 (1) Refer to Appendix for reconciliation of non-GAAP measures. (2) Total net interest income includes negligible net interest income from CBHL Loan Yield(1)(4) and Deposit Rate(4) Trends Cumulative Downcycle Betas (3) (3) Deposit betas are cumulative for the cycle easing rate cycle (since August 2024); Interest-bearing Deposit Betas include Brokered CD’s (4) Loan yields and deposit rate trends include net purchase accounting adjustments Note: 3Q 2025 includes the $4.6 million (56 bps of NIM or 59 bps of Core NIM) Call of Brokered Time Deposits and $1.3 million (16 bps of NIM or 17 bps of Core NIM) Interest Income Adjustment. Excluding these items, 3Q 2025 NIM would have been 5.96% and Core NIM would have been 4.24%. Net PAA Contribution to Core NIM $0.9mm or 11bps $0.2mm or 2bps $0.4mm or 5bps $0.3mm or 4bps $0.4mm or 5bps (1)
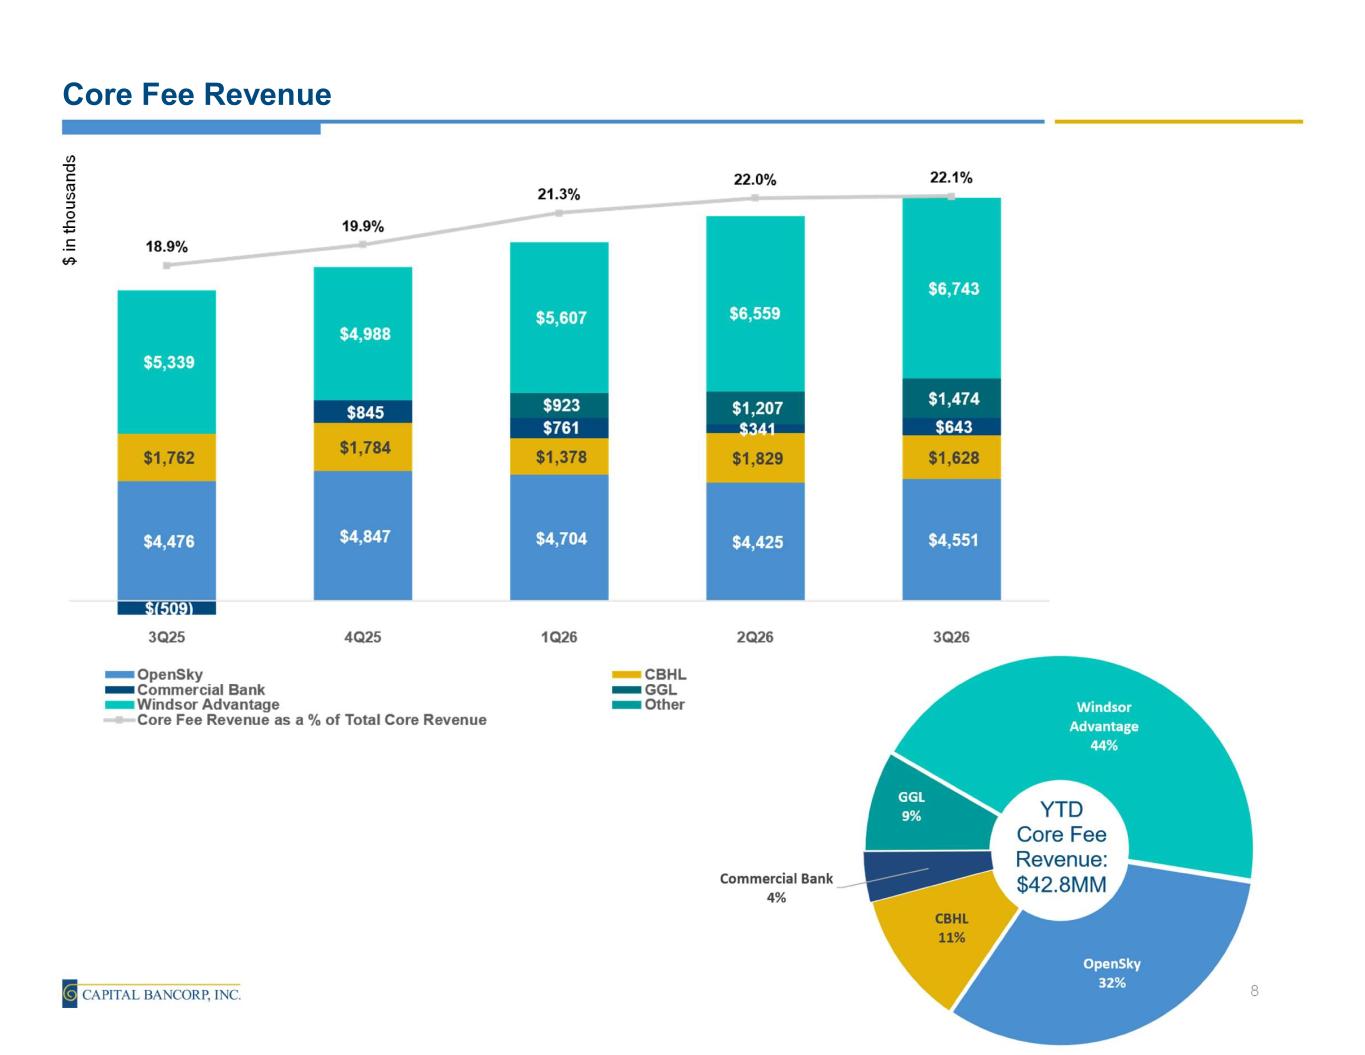
Core Fee Revenue $ in t ho us an d s 8
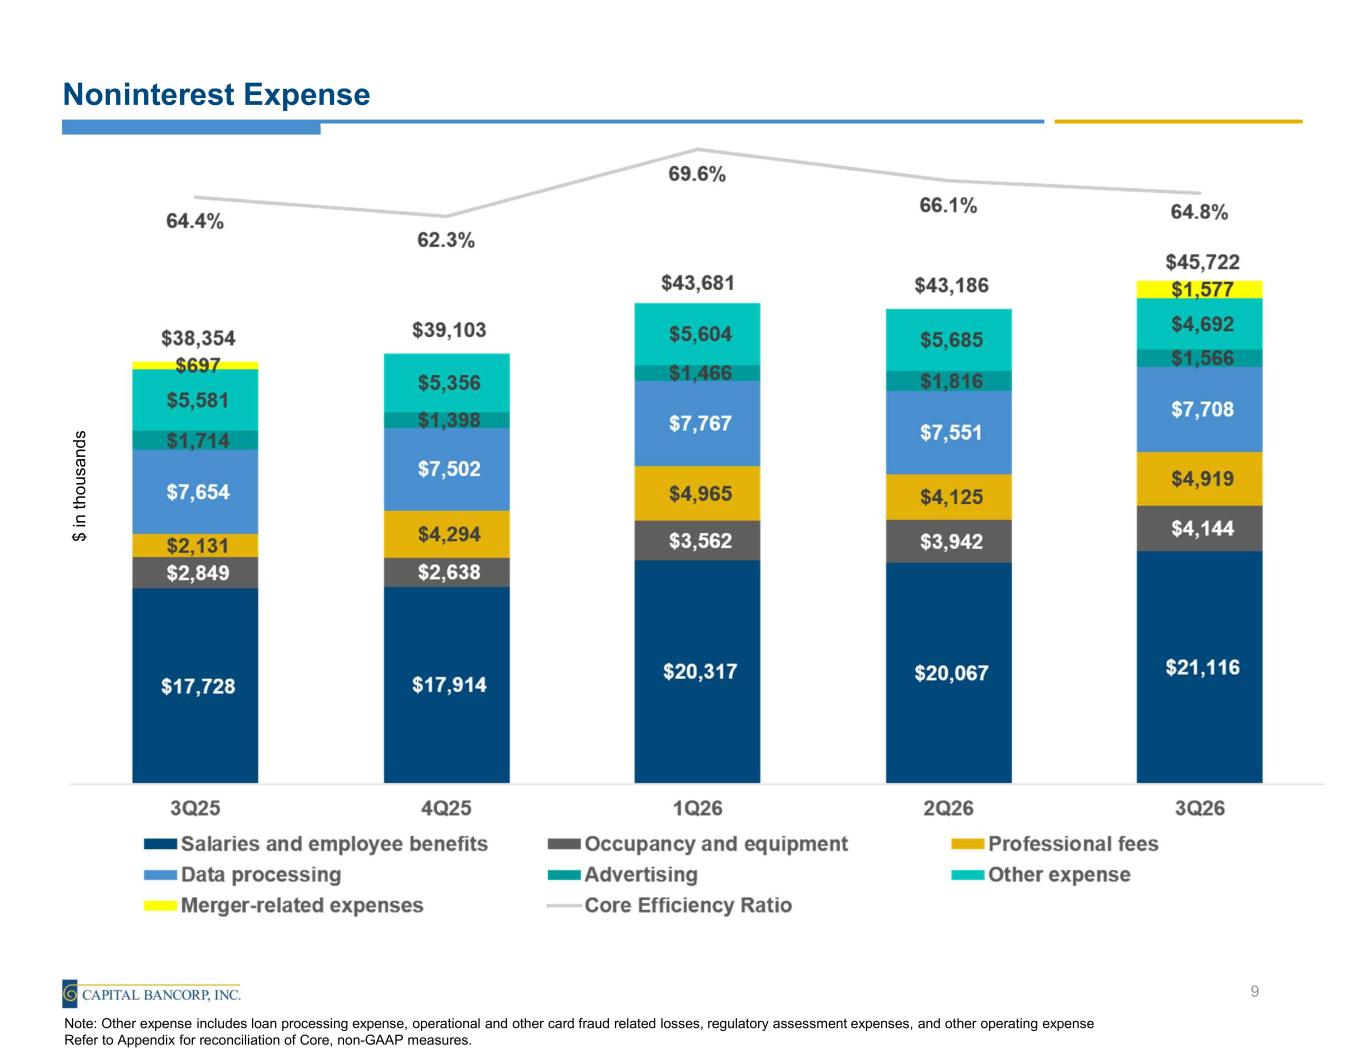
Noninterest Expense $ in t ho us an d s 9 Note: Other expense includes loan processing expense, operational and other card fraud related losses, regulatory assessment expenses, and other operating expense Refer to Appendix for reconciliation of Core, non-GAAP measures.
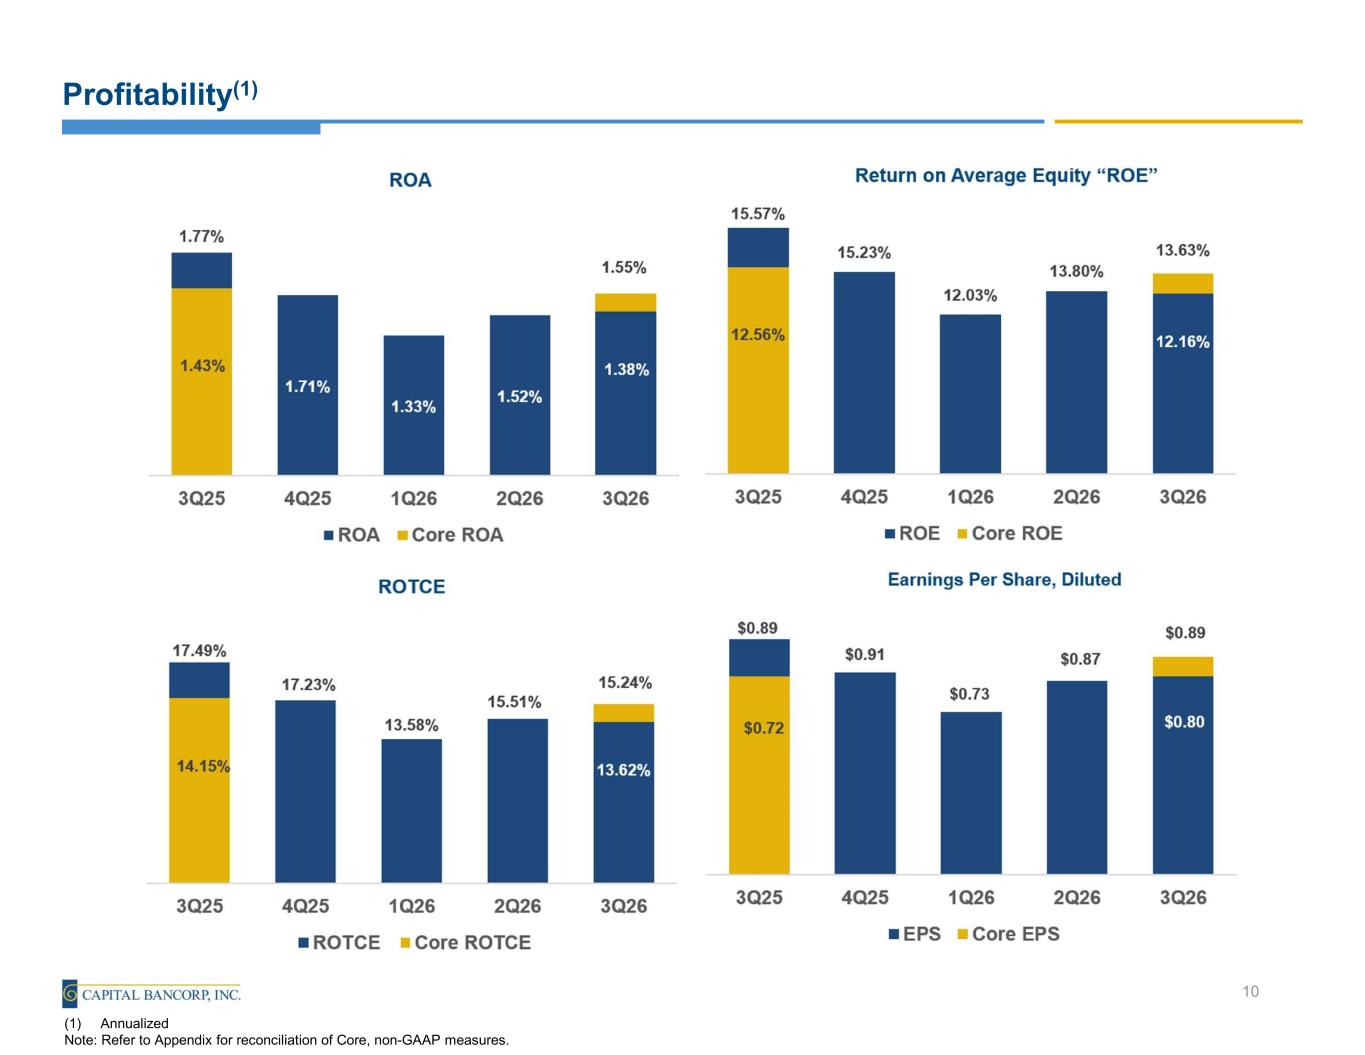
Profitability(1) 10 (1) Annualized Note: Refer to Appendix for reconciliation of Core, non-GAAP measures.
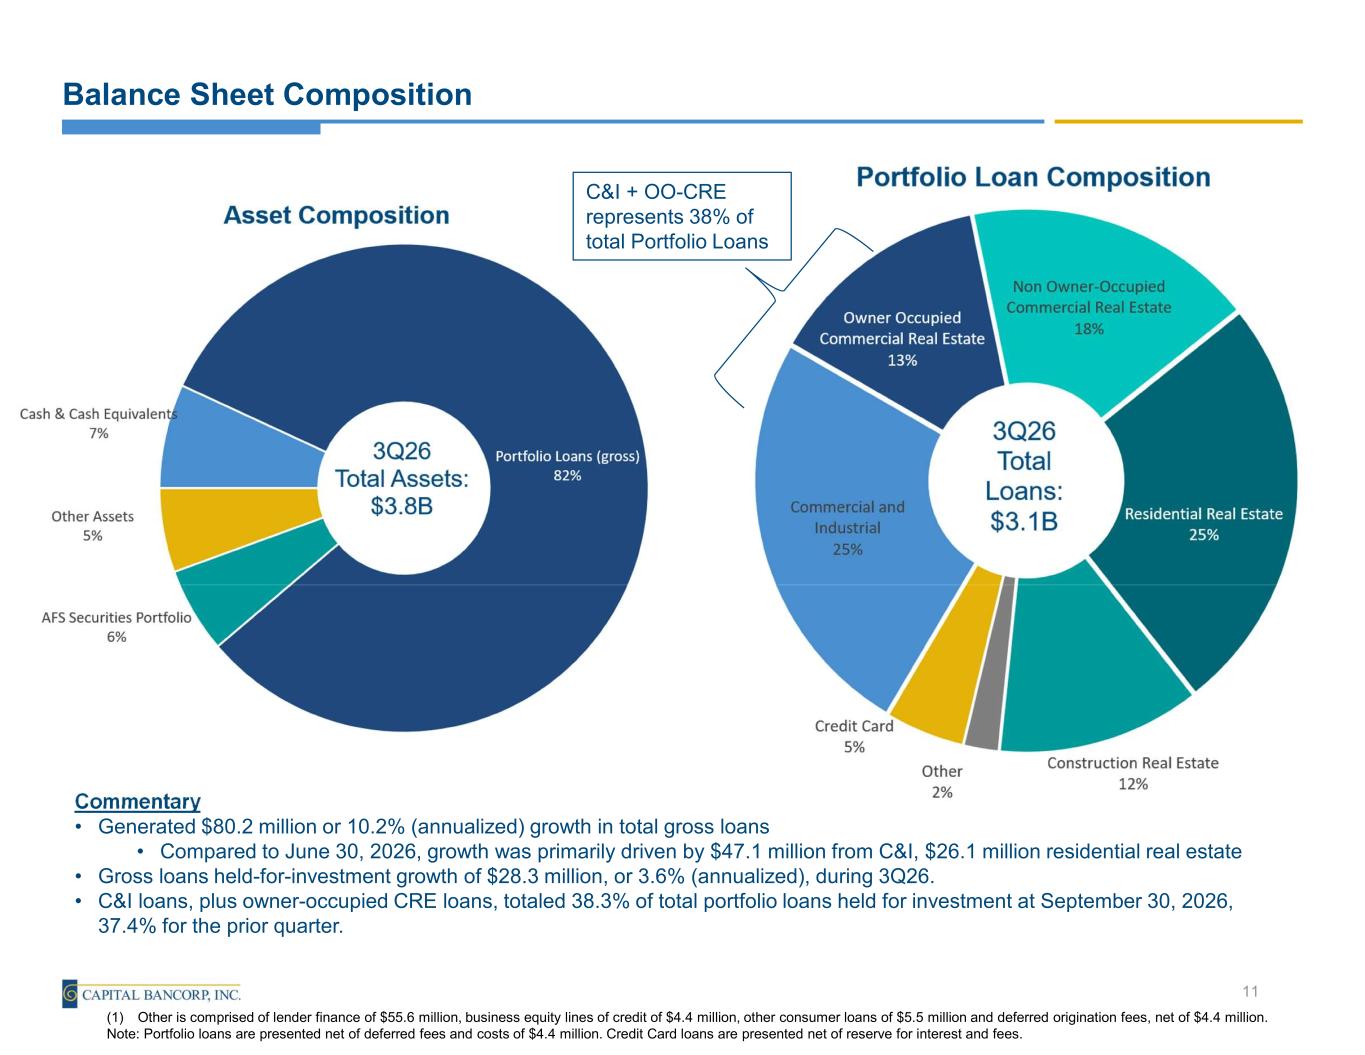
Balance Sheet Composition Commentary • Generated $80.2 million or 10.2% (annualized) growth in total gross loans • Compared to June 30, 2026, growth was primarily driven by $47.1 million from C&I, $26.1 million residential real estate • Gross loans held-for-investment growth of $28.3 million, or 3.6% (annualized), during 3Q26. • C&I loans, plus owner-occupied CRE loans, totaled 38.3% of total portfolio loans held for investment at September 30, 2026, 37.4% for the prior quarter. 11 (1) Other is comprised of lender finance of $55.6 million, business equity lines of credit of $4.4 million, other consumer loans of $5.5 million and deferred origination fees, net of $4.4 million. Note: Portfolio loans are presented net of deferred fees and costs of $4.4 million. Credit Card loans are presented net of reserve for interest and fees. C&I + OO-CRE represents 38% of total Portfolio Loans
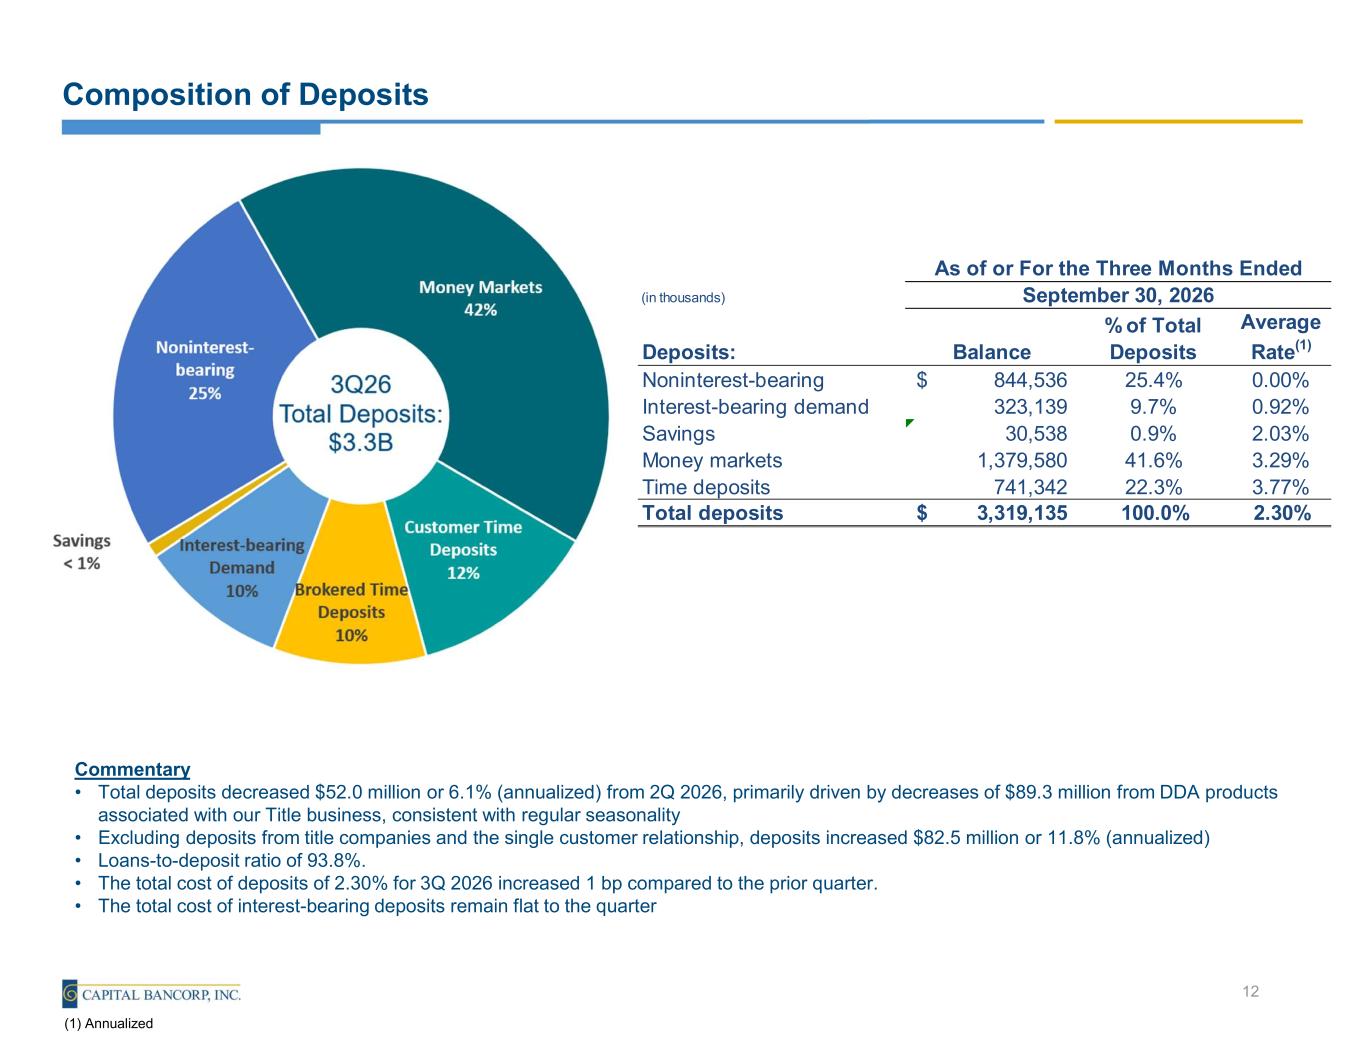
Composition of Deposits Commentary • Total deposits decreased $52.0 million or 6.1% (annualized) from 2Q 2026, primarily driven by decreases of $89.3 million from DDA products associated with our Title business, consistent with regular seasonality • Excluding deposits from title companies and the single customer relationship, deposits increased $82.5 million or 11.8% (annualized) • Loans-to-deposit ratio of 93.8%. • The total cost of deposits of 2.30% for 3Q 2026 increased 1 bp compared to the prior quarter. • The total cost of interest-bearing deposits remain flat to the quarter 12 (1) Annualized (in thousands) Deposits: Balance % of Total Deposits Average Rate(1) Noninterest-bearing 844,536$ 25.4% 0.00% Interest-bearing demand 323,139 9.7% 0.92% Savings 30,538 0.9% 2.03% Money markets 1,379,580 41.6% 3.29% Time deposits 741,342 22.3% 3.77% Total deposits 3,319,135$ 100.0% 2.30% As of or For the Three Months Ended September 30, 2026
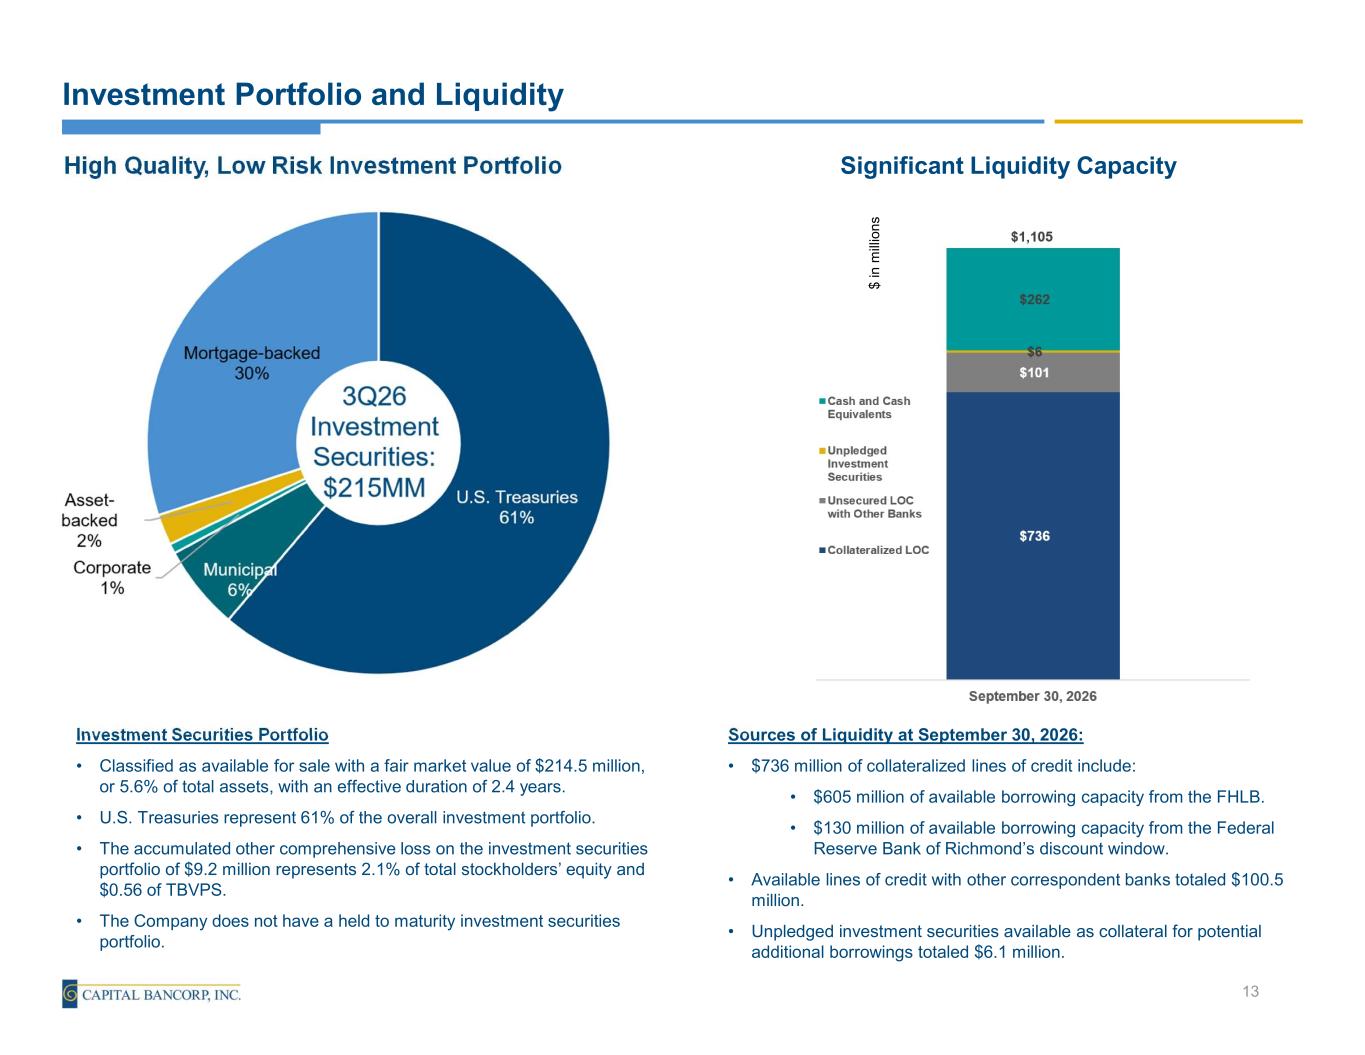
Investment Portfolio and Liquidity Investment Securities Portfolio • Classified as available for sale with a fair market value of $214.5 million, or 5.6% of total assets, with an effective duration of 2.4 years. • U.S. Treasuries represent 61% of the overall investment portfolio. • The accumulated other comprehensive loss on the investment securities portfolio of $9.2 million represents 2.1% of total stockholders’ equity and $0.56 of TBVPS. • The Company does not have a held to maturity investment securities portfolio. 13 High Quality, Low Risk Investment Portfolio Sources of Liquidity at September 30, 2026: • $736 million of collateralized lines of credit include: • $605 million of available borrowing capacity from the FHLB. • $130 million of available borrowing capacity from the Federal Reserve Bank of Richmond’s discount window. • Available lines of credit with other correspondent banks totaled $100.5 million. • Unpledged investment securities available as collateral for potential additional borrowings totaled $6.1 million. Significant Liquidity Capacity $ in m ill io n s
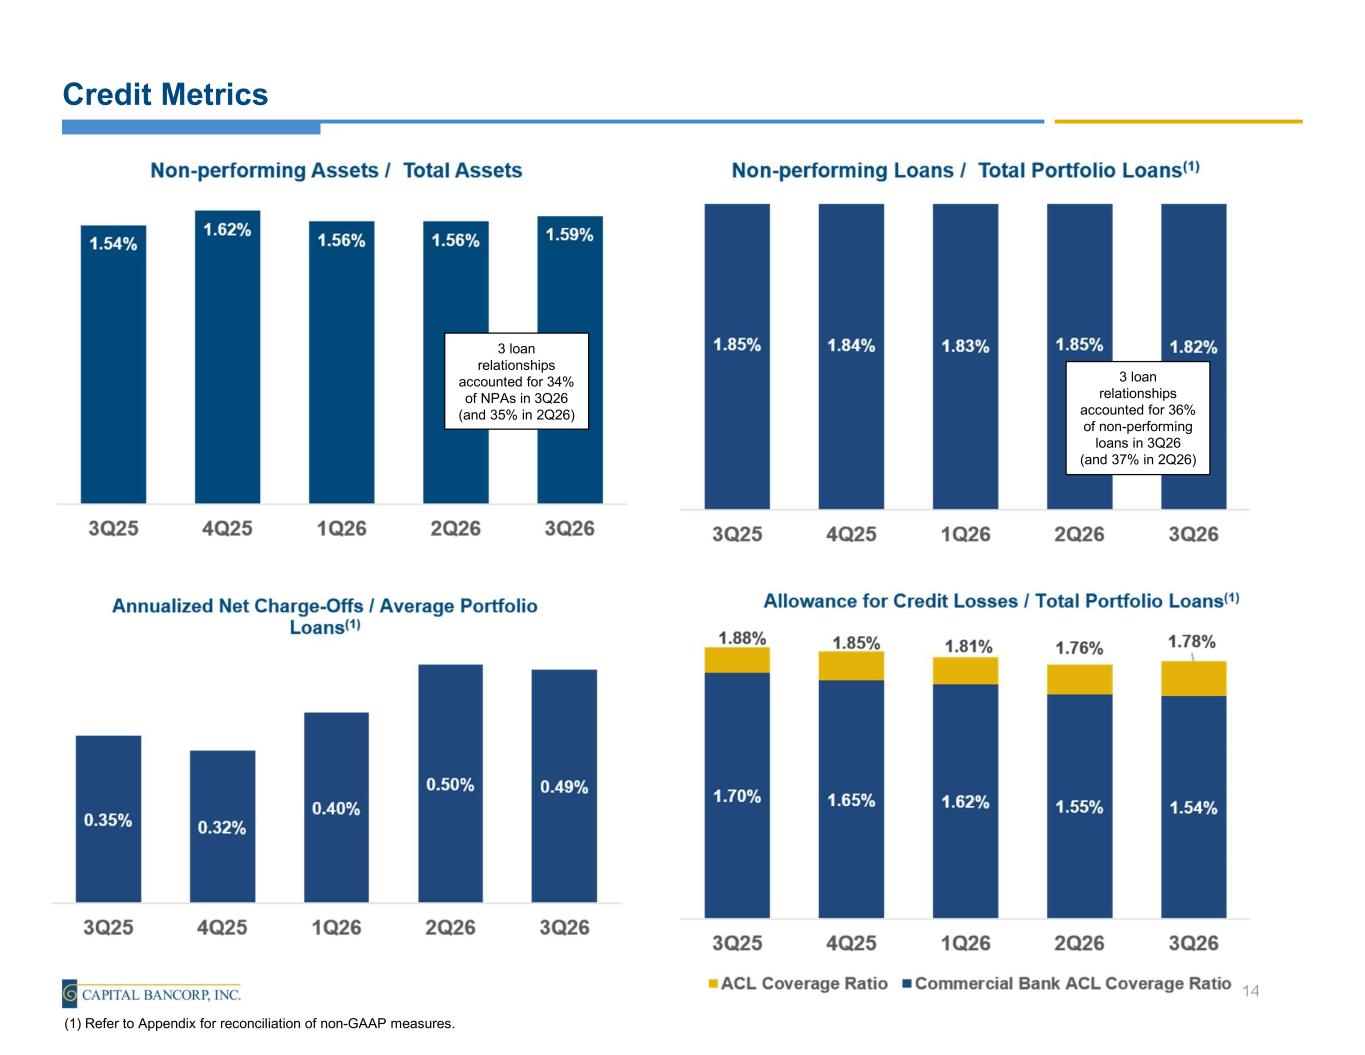
Credit Metrics 14 (1) Refer to Appendix for reconciliation of non-GAAP measures. 3 loan relationships accounted for 36% of non-performing loans in 3Q26 (and 37% in 2Q26) 3 loan relationships accounted for 34% of NPAs in 3Q26 (and 35% in 2Q26)
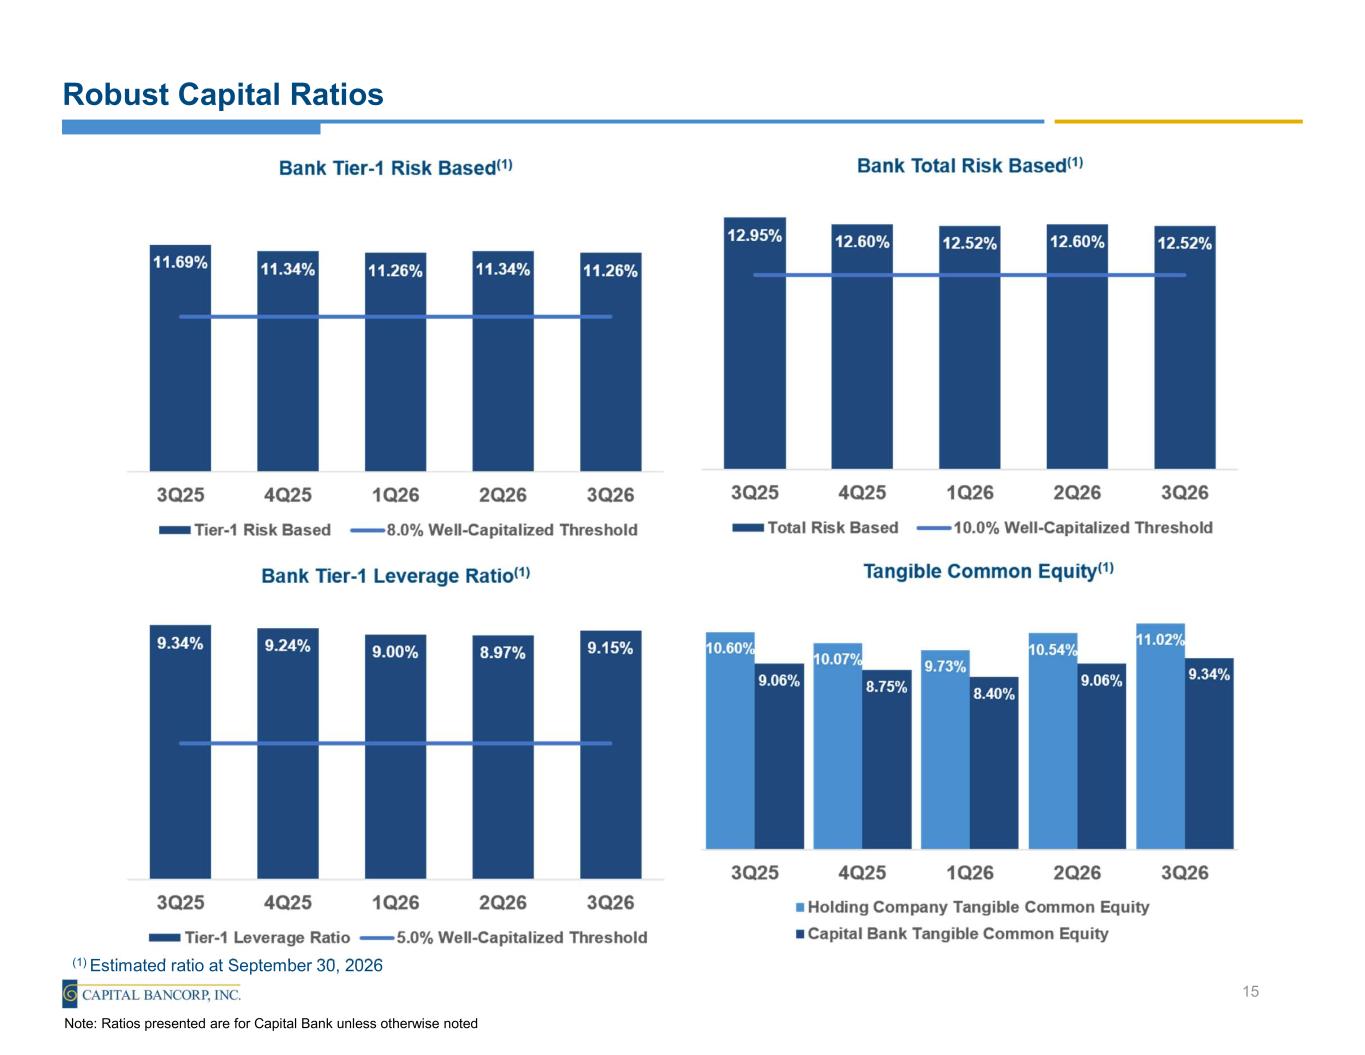
Robust Capital Ratios 15 Note: Ratios presented are for Capital Bank unless otherwise noted (1) Estimated ratio at September 30, 2026
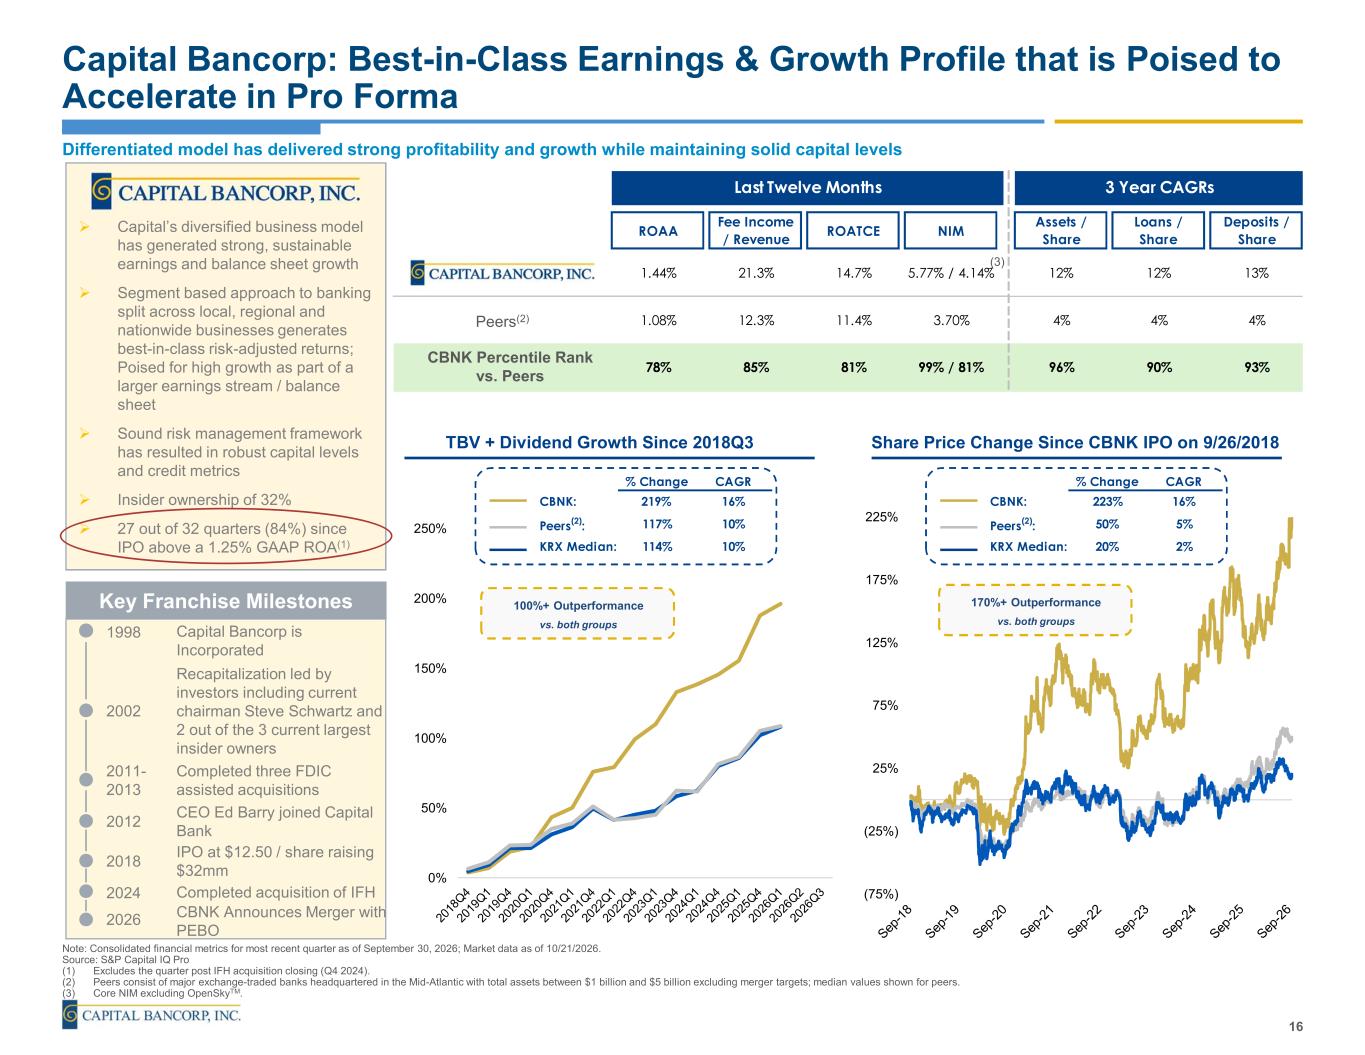
Last Twelve Months 3 Year CAGRs ROAA Fee Income / Revenue ROATCE NIM Assets / Share Loans / Share Deposits / Share 1.44% 21.3% 14.7% 5.77% / 4.14% 12% 12% 13% 1.08% 12.3% 11.4% 3.70% 4% 4% 4% 78% 85% 81% 99% / 81% 96% 90% 93% Capital Bancorp: Best-in-Class Earnings & Growth Profile that is Poised to Accelerate in Pro Forma Note: Consolidated financial metrics for most recent quarter as of September 30, 2026; Market data as of 10/21/2026. Source: S&P Capital IQ Pro (1) Excludes the quarter post IFH acquisition closing (Q4 2024). (2) Peers consist of major exchange-traded banks headquartered in the Mid-Atlantic with total assets between $1 billion and $5 billion excluding merger targets; median values shown for peers. (3) Core NIM excluding OpenSkyTM. 16 Differentiated model has delivered strong profitability and growth while maintaining solid capital levels Capital’s diversified business model has generated strong, sustainable earnings and balance sheet growth Segment based approach to banking split across local, regional and nationwide businesses generates best-in-class risk-adjusted returns; Poised for high growth as part of a larger earnings stream / balance sheet Sound risk management framework has resulted in robust capital levels and credit metrics Insider ownership of 32% 27 out of 32 quarters (84%) since IPO above a 1.25% GAAP ROA(1) Key Franchise Milestones 2024 2018 2002 1998 Capital Bancorp is Incorporated IPO at $12.50 / share raising $32mm Recapitalization led by investors including current chairman Steve Schwartz and 2 out of the 3 current largest insider owners Completed acquisition of IFH CEO Ed Barry joined Capital Bank 2012 Peers(2) CBNK Percentile Rank vs. Peers (3) TBV + Dividend Growth Since 2018Q3 Share Price Change Since CBNK IPO on 9/26/2018 2011- 2013 Completed three FDIC assisted acquisitions (3) % Change CAGR CBNK: 219% 16% Peers(2): 117% 10% KRX Median: 114% 10% % Change CAGR CBNK: 223% 16% Peers(2): 50% 5% KRX Median: 20% 2% 2026 CBNK Announces Merger with PEBO 0% 50% 100% 150% 200% 250% (75%) (25%) 25% 75% 125% 175% 225% 170%+ Outperformance vs. both groups 100%+ Outperformance vs. both groups
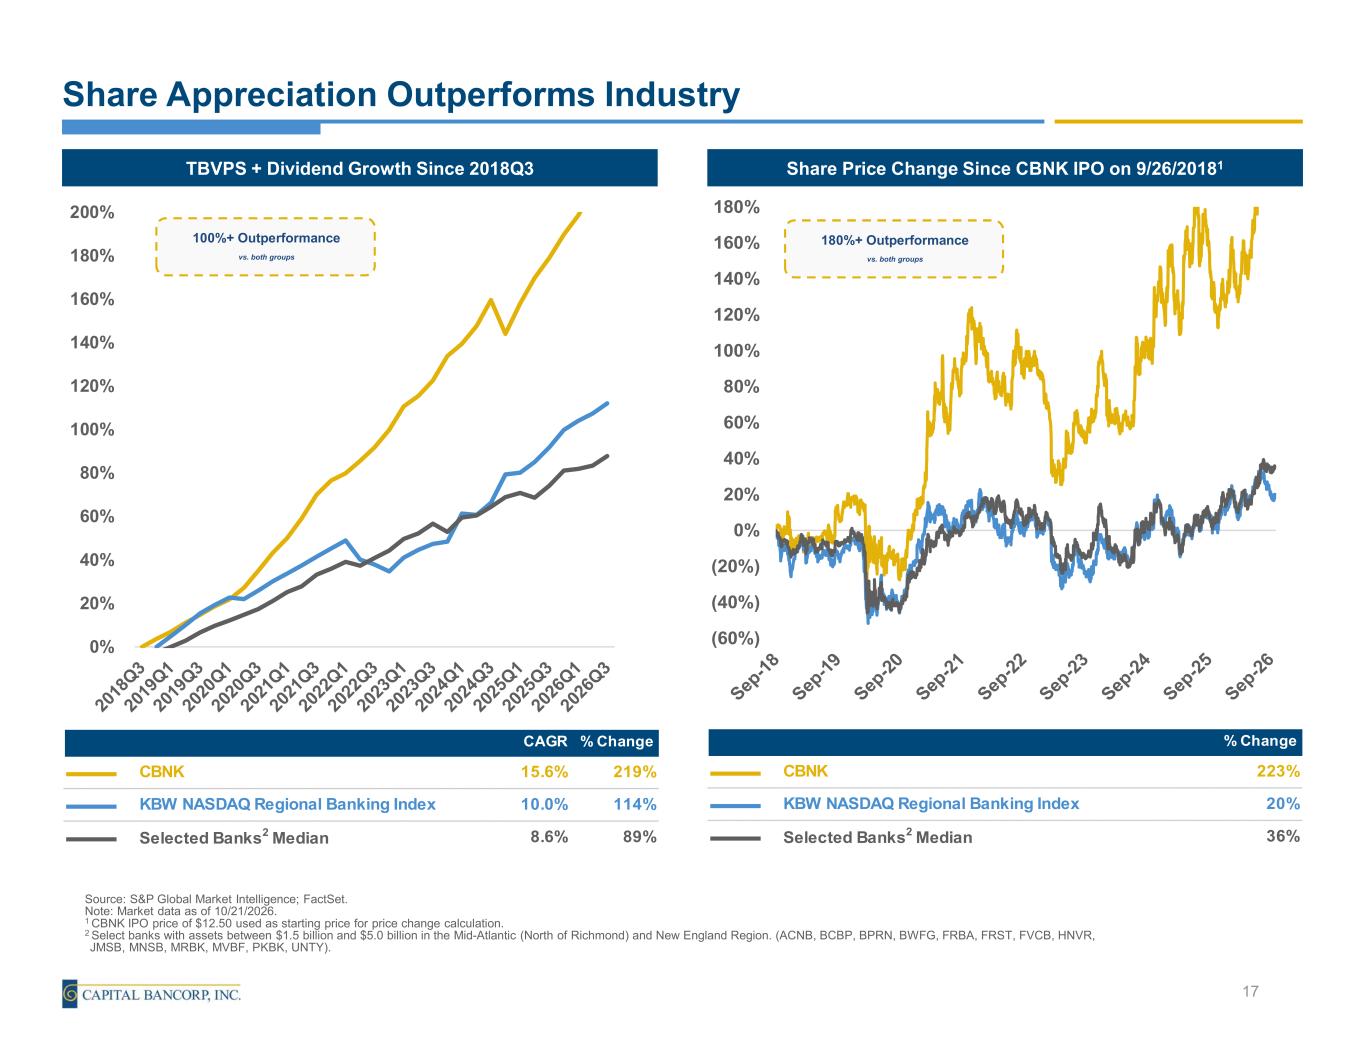
Share Appreciation Outperforms Industry 17 Share Price Change Since CBNK IPO on 9/26/20181TBVPS + Dividend Growth Since 2018Q3 100%+ Outperformance vs. both groups 180%+ Outperformance vs. both groups Source: S&P Global Market Intelligence; FactSet. Note: Market data as of 10/21/2026. 1 CBNK IPO price of $12.50 used as starting price for price change calculation. 2 Select banks with assets between $1.5 billion and $5.0 billion in the Mid-Atlantic (North of Richmond) and New England Region. (ACNB, BCBP, BPRN, BWFG, FRBA, FRST, FVCB, HNVR, JMSB, MNSB, MRBK, MVBF, PKBK, UNTY). CAGR % Change CBNK 15.6% 219% KBW NASDAQ Regional Banking Index 10.0% 114% Selected Banks2 Median 8.6% 89% 0% 20% 40% 60% 80% 100% 120% 140% 160% 180% 200% 58.48% (60%) (40%) (20%) 0% 20% 40% 60% 80% 100% 120% 140% 160% 180% % Change CBNK 223% KBW NASDAQ Regional Banking Index 20% Selected Banks2 Median 36%

Jake Dalaya Chief Financial Officer (301)-637-5118 NASDAQ: CBNK

Non-U.S. GAAP Financial Measures
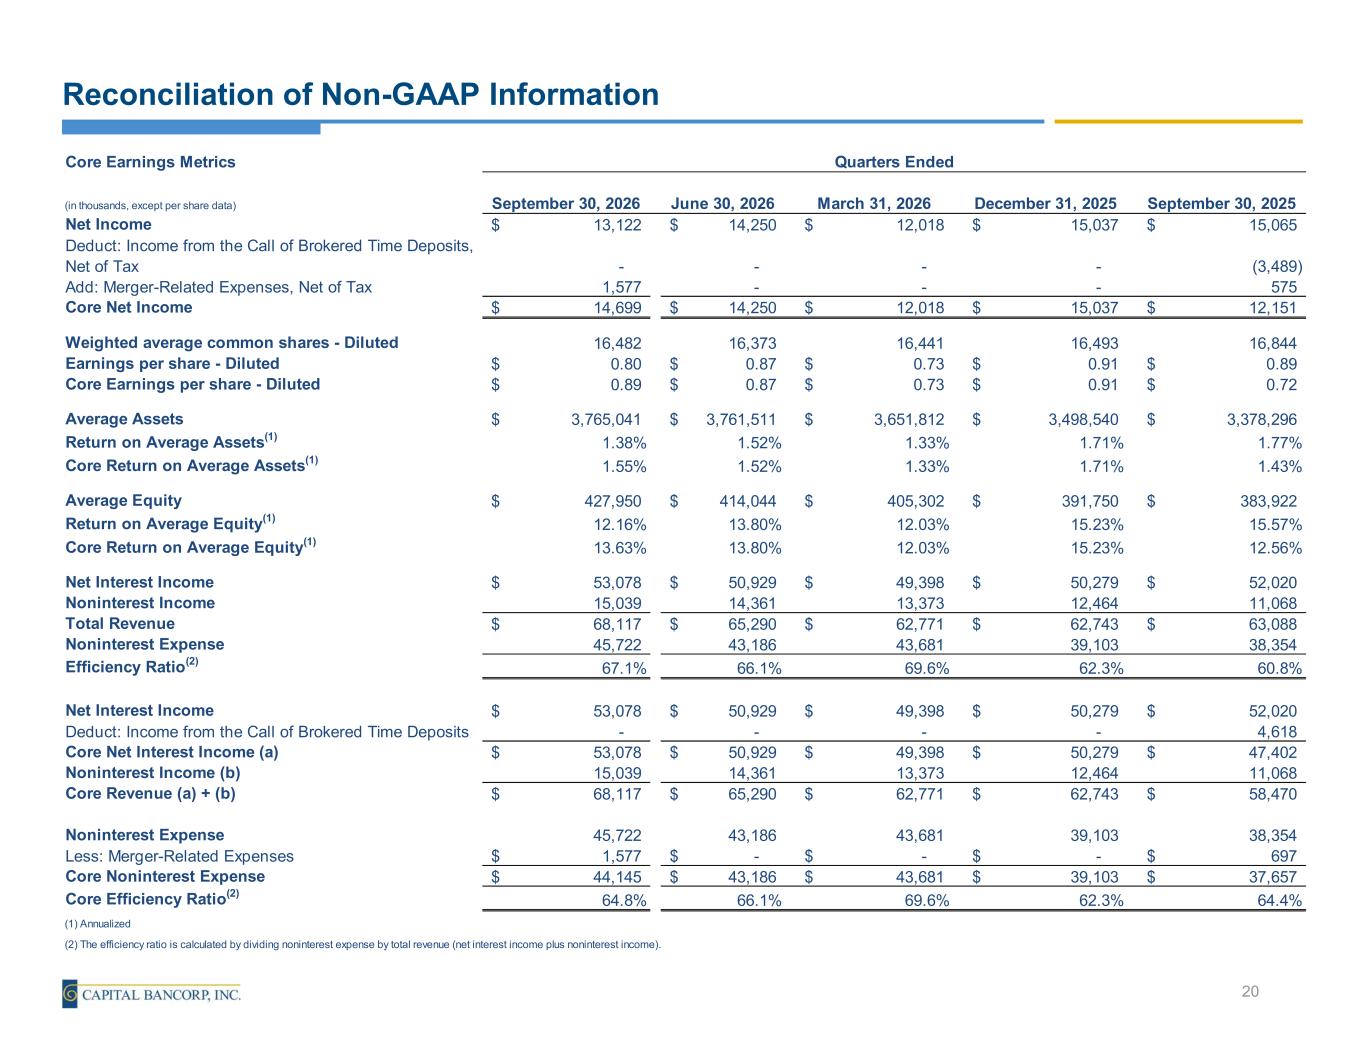
Reconciliation of Non-GAAP Information 20 Core Earnings Metrics (in thousands, except per share data) September 30, 2026 June 30, 2026 March 31, 2026 December 31, 2025 September 30, 2025 Net Income 13,122$ 14,250$ 12,018$ 15,037$ 15,065$ Deduct: Income from the Call of Brokered Time Deposits, Net of Tax - - - - (3,489) Add: Merger-Related Expenses, Net of Tax 1,577 - - - 575 Core Net Income 14,699$ 14,250$ 12,018$ 15,037$ 12,151$ Weighted average common shares - Diluted 16,482 16,373 16,441 16,493 16,844 Earnings per share - Diluted 0.80$ 0.87$ 0.73$ 0.91$ 0.89$ Core Earnings per share - Diluted 0.89$ 0.87$ 0.73$ 0.91$ 0.72$ Average Assets 3,765,041$ 3,761,511$ 3,651,812$ 3,498,540$ 3,378,296$ Return on Average Assets(1) 1.38% 1.52% 1.33% 1.71% 1.77% Core Return on Average Assets(1) 1.55% 1.52% 1.33% 1.71% 1.43% Average Equity 427,950$ 414,044$ 405,302$ 391,750$ 383,922$ Return on Average Equity(1) 12.16% 13.80% 12.03% 15.23% 15.57% Core Return on Average Equity(1) 13.63% 13.80% 12.03% 15.23% 12.56% Net Interest Income 53,078$ 50,929$ 49,398$ 50,279$ 52,020$ Noninterest Income 15,039 14,361 13,373 12,464 11,068 Total Revenue 68,117$ 65,290$ 62,771$ 62,743$ 63,088$ Noninterest Expense 45,722 43,186 43,681 39,103 38,354 Efficiency Ratio(2) 67.1% 66.1% 69.6% 62.3% 60.8% Net Interest Income 53,078$ 50,929$ 49,398$ 50,279$ 52,020$ Deduct: Income from the Call of Brokered Time Deposits - - - - 4,618 Core Net Interest Income (a) 53,078$ 50,929$ 49,398$ 50,279$ 47,402$ Noninterest Income (b) 15,039 14,361 13,373 12,464 11,068 Core Revenue (a) + (b) 68,117$ 65,290$ 62,771$ 62,743$ 58,470$ Noninterest Expense 45,722 43,186 43,681 39,103 38,354 Less: Merger-Related Expenses 1,577$ -$ -$ -$ 697$ Core Noninterest Expense 44,145$ 43,186$ 43,681$ 39,103$ 37,657$ Core Efficiency Ratio(2) 64.8% 66.1% 69.6% 62.3% 64.4% (1) Annualized (2) The efficiency ratio is calculated by dividing noninterest expense by total revenue (net interest income plus noninterest income). Quarters Ended
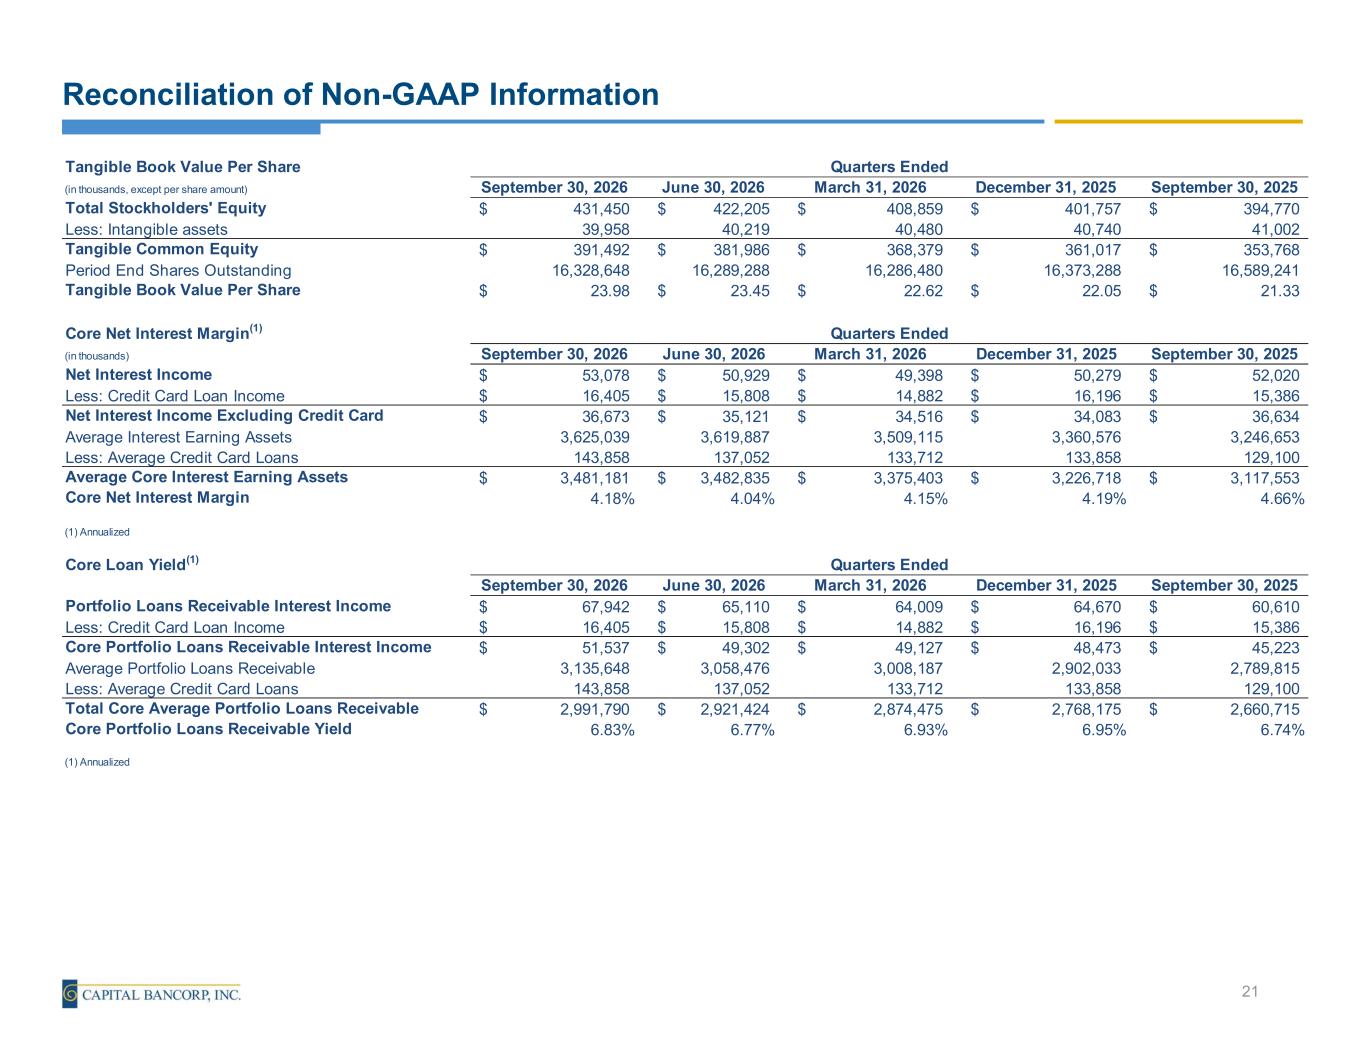
Reconciliation of Non-GAAP Information 21 Tangible Book Value Per Share (in thousands, except per share amount) September 30, 2026 June 30, 2026 March 31, 2026 December 31, 2025 September 30, 2025 Total Stockholders' Equity 431,450$ 422,205$ 408,859$ 401,757$ 394,770$ Less: Intangible assets 39,958 40,219 40,480 40,740 41,002 Tangible Common Equity 391,492$ 381,986$ 368,379$ 361,017$ 353,768$ Period End Shares Outstanding 16,328,648 16,289,288 16,286,480 16,373,288 16,589,241 Tangible Book Value Per Share 23.98$ 23.45$ 22.62$ 22.05$ 21.33$ Core Net Interest Margin(1) (in thousands) September 30, 2026 June 30, 2026 March 31, 2026 December 31, 2025 September 30, 2025 Net Interest Income 53,078$ 50,929$ 49,398$ 50,279$ 52,020$ Less: Credit Card Loan Income 16,405$ 15,808$ 14,882$ 16,196$ 15,386$ Net Interest Income Excluding Credit Card 36,673$ 35,121$ 34,516$ 34,083$ 36,634$ Average Interest Earning Assets 3,625,039 3,619,887 3,509,115 3,360,576 3,246,653 Less: Average Credit Card Loans 143,858 137,052 133,712 133,858 129,100 Average Core Interest Earning Assets 3,481,181$ 3,482,835$ 3,375,403$ 3,226,718$ 3,117,553$ Core Net Interest Margin 4.18% 4.04% 4.15% 4.19% 4.66% (1) Annualized Core Loan Yield(1) September 30, 2026 June 30, 2026 March 31, 2026 December 31, 2025 September 30, 2025 Portfolio Loans Receivable Interest Income 67,942$ 65,110$ 64,009$ 64,670$ 60,610$ Less: Credit Card Loan Income 16,405$ 15,808$ 14,882$ 16,196$ 15,386$ Core Portfolio Loans Receivable Interest Income 51,537$ 49,302$ 49,127$ 48,473$ 45,223$ Average Portfolio Loans Receivable 3,135,648 3,058,476 3,008,187 2,902,033 2,789,815 Less: Average Credit Card Loans 143,858 137,052 133,712 133,858 129,100 Total Core Average Portfolio Loans Receivable 2,991,790$ 2,921,424$ 2,874,475$ 2,768,175$ 2,660,715$ Core Portfolio Loans Receivable Yield 6.83% 6.77% 6.93% 6.95% 6.74% (1) Annualized Quarters Ended Quarters Ended Quarters Ended
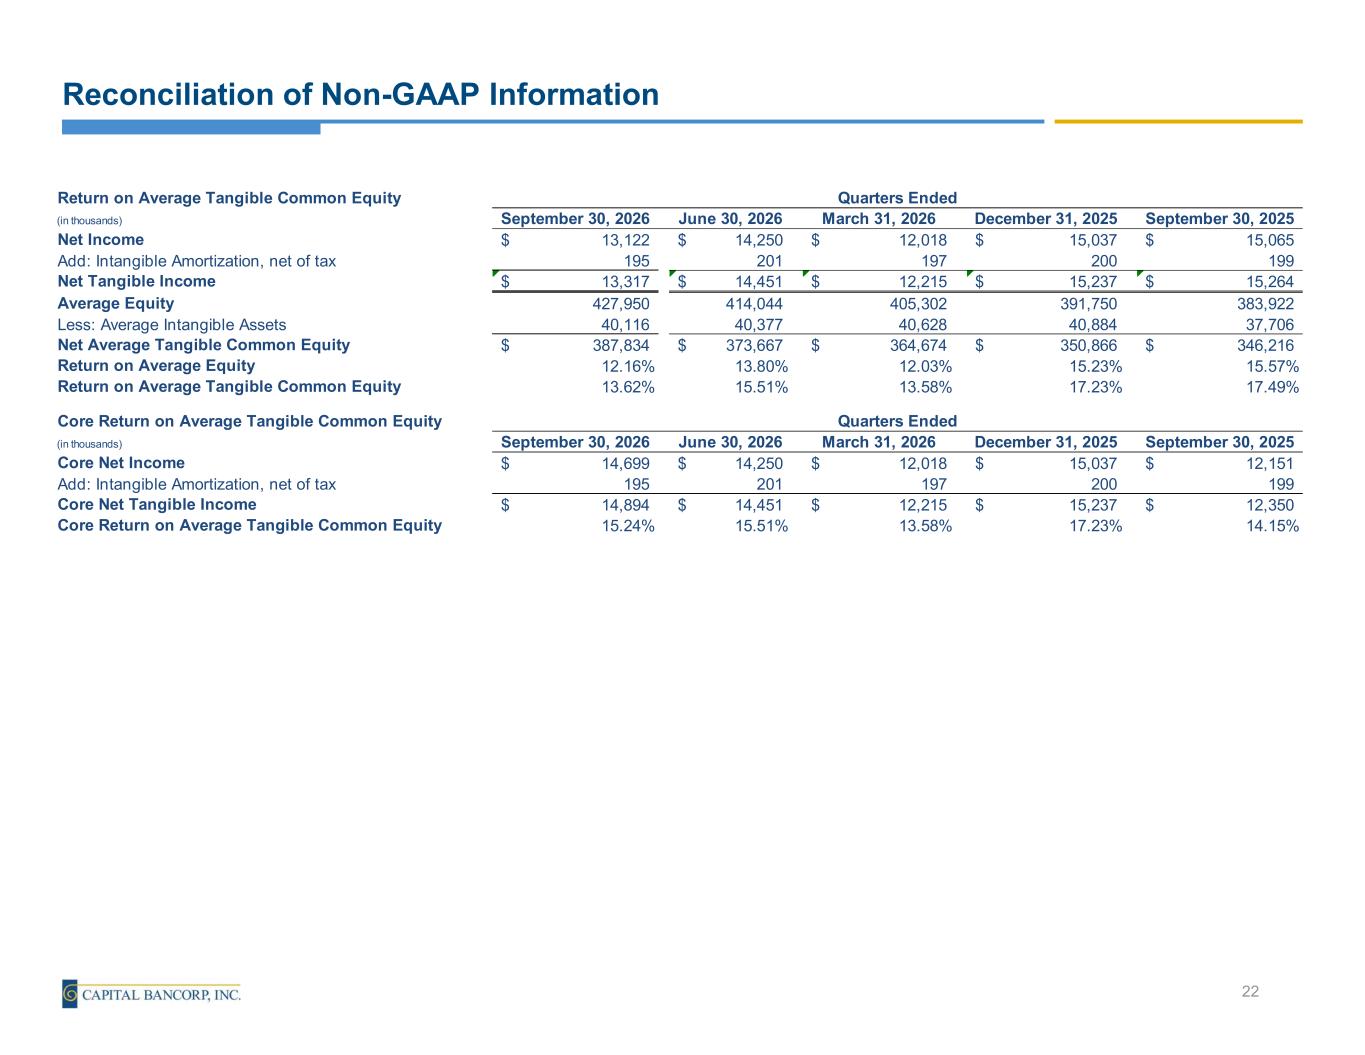
Reconciliation of Non-GAAP Information 22 Return on Average Tangible Common Equity (in thousands) September 30, 2026 June 30, 2026 March 31, 2026 December 31, 2025 September 30, 2025 Net Income 13,122$ 14,250$ 12,018$ 15,037$ 15,065$ Add: Intangible Amortization, net of tax 195 201 197 200 199 Net Tangible Income 13,317$ 14,451$ 12,215$ 15,237$ 15,264$ Average Equity 427,950 414,044 405,302 391,750 383,922 Less: Average Intangible Assets 40,116 40,377 40,628 40,884 37,706 Net Average Tangible Common Equity 387,834$ 373,667$ 364,674$ 350,866$ 346,216$ Return on Average Equity 12.16% 13.80% 12.03% 15.23% 15.57% Return on Average Tangible Common Equity 13.62% 15.51% 13.58% 17.23% 17.49% Core Return on Average Tangible Common Equity (in thousands) September 30, 2026 June 30, 2026 March 31, 2026 December 31, 2025 September 30, 2025 Core Net Income 14,699$ 14,250$ 12,018$ 15,037$ 12,151$ Add: Intangible Amortization, net of tax 195 201 197 200 199 Core Net Tangible Income 14,894$ 14,451$ 12,215$ 15,237$ 12,350$ Core Return on Average Tangible Common Equity 15.24% 15.51% 13.58% 17.23% 14.15% Quarters Ended Quarters Ended
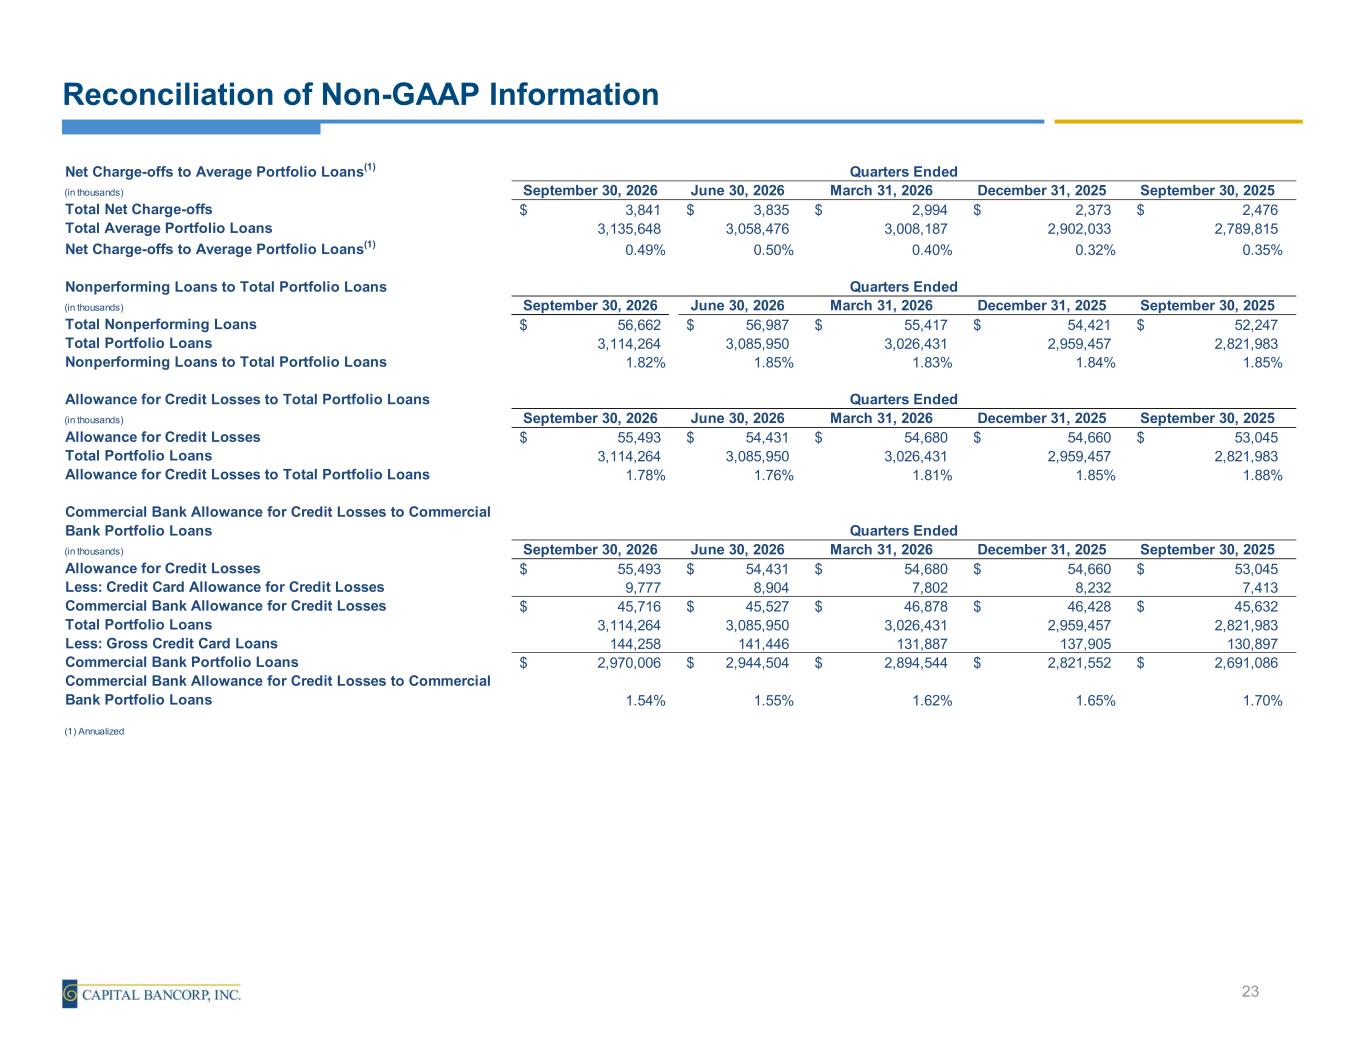
Reconciliation of Non-GAAP Information 23 Net Charge-offs to Average Portfolio Loans(1) (in thousands) September 30, 2026 June 30, 2026 March 31, 2026 December 31, 2025 September 30, 2025 Total Net Charge-offs 3,841$ 3,835$ 2,994$ 2,373$ 2,476$ Total Average Portfolio Loans 3,135,648 3,058,476 3,008,187 2,902,033 2,789,815 Net Charge-offs to Average Portfolio Loans(1) 0.49% 0.50% 0.40% 0.32% 0.35% Nonperforming Loans to Total Portfolio Loans (in thousands) September 30, 2026 June 30, 2026 March 31, 2026 December 31, 2025 September 30, 2025 Total Nonperforming Loans 56,662$ 56,987$ 55,417$ 54,421$ 52,247$ Total Portfolio Loans 3,114,264 3,085,950 3,026,431 2,959,457 2,821,983 Nonperforming Loans to Total Portfolio Loans 1.82% 1.85% 1.83% 1.84% 1.85% Allowance for Credit Losses to Total Portfolio Loans (in thousands) September 30, 2026 June 30, 2026 March 31, 2026 December 31, 2025 September 30, 2025 Allowance for Credit Losses 55,493$ 54,431$ 54,680$ 54,660$ 53,045$ Total Portfolio Loans 3,114,264 3,085,950 3,026,431 2,959,457 2,821,983 Allowance for Credit Losses to Total Portfolio Loans 1.78% 1.76% 1.81% 1.85% 1.88% Commercial Bank Allowance for Credit Losses to Commercial Bank Portfolio Loans (in thousands) September 30, 2026 June 30, 2026 March 31, 2026 December 31, 2025 September 30, 2025 Allowance for Credit Losses 55,493$ 54,431$ 54,680$ 54,660$ 53,045$ Less: Credit Card Allowance for Credit Losses 9,777 8,904 7,802 8,232 7,413 Commercial Bank Allowance for Credit Losses 45,716$ 45,527$ 46,878$ 46,428$ 45,632$ Total Portfolio Loans 3,114,264 3,085,950 3,026,431 2,959,457 2,821,983 Less: Gross Credit Card Loans 144,258 141,446 131,887 137,905 130,897 Commercial Bank Portfolio Loans 2,970,006$ 2,944,504$ 2,894,544$ 2,821,552$ 2,691,086$ Commercial Bank Allowance for Credit Losses to Commercial Bank Portfolio Loans 1.54% 1.55% 1.62% 1.65% 1.70% (1) Annualized Quarters Ended Quarters Ended Quarters Ended Quarters Ended